Statistiche di base
| Proprietari istituzionali | 1710 total, 1644 long only, 8 short only, 58 long/short - change of 2,47% MRQ |
| Allocazione media del portafoglio | 2.3907 % - change of 7,29% MRQ |
| Azioni istituzionali (Long) | 369.986.520 (ex 13D/G) - change of -63,94MM shares -4,75% MRQ |
| Valore istituzionale (Long) | $ 46.139.160 USD ($1000) |
Proprietà istituzionale e azionisti
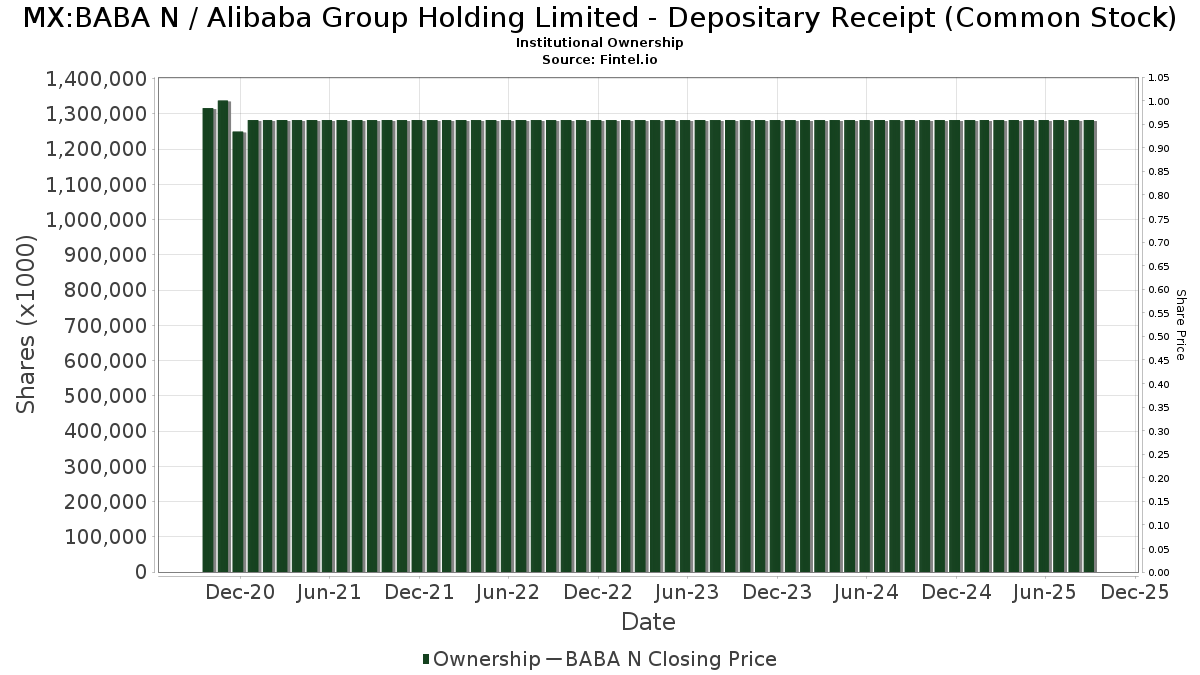
Alibaba Group Holding Limited - Depositary Receipt (Common Stock) (MX:BABA N) ha 1710 proprietari istituzionali e azionisti che hanno presentato i moduli 13D/G o 13F alla Securities Exchange Commission (SEC). Queste istituzioni detengono un totale di 371,376,809 azioni. I maggiori azionisti includono Susquehanna International Group, Llp, Jpmorgan Chase & Co, Primecap Management Co/ca/, TEQKX - TIAA-CREF Emerging Markets Equity Index Fund Retail Class, Citadel Advisors Llc, Jane Street Group, Llc, VPMCX - Vanguard PRIMECAP Fund Investor Shares, Fmr Llc, UBS Group AG, and Jane Street Group, Llc .
(Alibaba Group Holding Limited - Depositary Receipt (Common Stock) (BMV:BABA N) la struttura proprietaria istituzionale mostra le attuali posizioni nella società da parte di istituzioni e fondi, nonché le ultime variazioni nella dimensione della posizione. I principali azionisti possono essere singoli investitori, fondi comuni, hedge fund o istituzioni. L'allegato 13D indica che l'investitore detiene (o ha detenuto) più del 5% della società e intende (o intendeva) perseguire attivamente un cambiamento nella strategia aziendale. L'allegato 13G indica un investimento passivo superiore al 5%.
Indice del sentiment dei fondi
L'indice del sentiment dei fondi (anche noto come "indice di accumulo di proprietà") individua i titoli più acquistati dai fondi. È il risultato di un sofisticato modello quantitativo multi-fattore che identifica le società con i più alti livelli di accumulo istituzionale. Il modello utilizza una combinazione dell'aumento totale dei proprietari dichiarati, delle variazioni nelle allocazioni di portafoglio di tali proprietari e di altre metriche. Il punteggio varia da 0 a 100: i numeri più alti indicano un livello di accumulo superiore ad altre società, mentre 50 rappresenta la media.
Frequenza di aggiornamento: giornaliera
Consulta Ownership Explorer per visualizzare l'elenco delle aziende con il ranking più alto.
AI+ Ask Fintel’s AI assistant about Alibaba Group Holding Limited - Depositary Receipt (Common Stock).
Select a question to share a public post with an AI-crafted answer.
Thinking of good questions…
Depositi 13F e NPORT
Le informazioni relative ai depositi 13F sono gratuite. Per accedere alle informazioni relative ai depositi NP è necessario un'abbonamento premium. Le righe verdi indicano le nuove posizioni. Le righe rosse indicano le posizioni chiuse. Fai clic sull'icona del link per visualizzare la cronologia completa delle transazioni.
Esegui l'upgrade
per sbloccare i dati premium ed esportarli in Excel ![]() .
.
Important Note
In an effort to reduce load times for our mobile users, we are testing some ways to deliver lighter pages.
In this first test, we will deliver only the most recent 750 transactions (out of 2255 for this stock). If you are interested in loading *all* the transactions for this company, click the "load all" button below. This is just a test and if you don't like it, please let us know by submitting some gentle feedback via the link at the bottom of this page.
Load All| Data di deposito | Fonte | Investitore | Tipo | Prezzo medio (Stima) |
Azioni | Δ Azioni (%) |
Valore dichiarato ($ 1000) |
Δ Valore (%) |
Allocazione del portafoglio (%) |
|
|---|---|---|---|---|---|---|---|---|---|---|
| 2025-11-14 | 13F | Fund 1 Investments, LLC | 16.900 | -43,67 | 3.021 | -11,23 | ||||
| 2026-02-10 | 13F | Rational Advisors Llc | 2.890 | 424 | ||||||
| 2025-08-26 | NP | GIEYX - INTERNATIONAL EQUITY FUND Institutional | 327.210 | 15,62 | 4.632 | -1,09 | ||||
| 2025-10-07 | 13F | Carolina Wealth Advisors, LLC | 0 | -100,00 | 0 | |||||
| 2025-11-14 | 13F | BLKBRD Asset Management, LP | 87.272 | 772,72 | 15.598 | 1.275,49 | ||||
| 2025-08-28 | NP | BlackRock Funds V - BlackRock Strategic Income Opportunities Portfolio Investor A Shares | 78.208 | 3,54 | 8.870 | -11,19 | ||||
| 2026-02-13 | 13F | Sei Investments Co | 350.743 | 17,68 | 51.413 | -3,48 | ||||
| 2025-11-06 | 13F | Claudia M.p. Batlle, Crp (r) Llc | 0 | -100,00 | 0 | |||||
| 2025-11-14 | 13F | Lighthouse Investment Partners, LLC | 6.947 | 1.242 | ||||||
| 2026-02-05 | 13F | Everstar Asset Management, LLC | 13.397 | -4,53 | 1.964 | -21,70 | ||||
| 2025-11-13 | 13F | Quinn Opportunity Partners LLC | 0 | -100,00 | 0 | |||||
| 2026-02-13 | 13F | Ausdal Financial Partners, Inc. | 7.392 | 0,09 | 1.083 | -17,89 | ||||
| 2026-01-30 | 13F | Jennison Associates Llc | 54.235 | 11,88 | 7.950 | -8,24 | ||||
| 2025-09-24 | NP | TWSMX - Strategic Allocation: Moderate Fund Investor Class This fund is a listed as child fund of American Century Companies Inc and if that institution has disclosed ownership in this security, then these positions will not be double counted when calculating total shares and total value | 3.568 | 0,00 | 430 | 0,94 | ||||
| 2026-02-12 | 13F | Keel Point, LLC | 1.877 | 0,81 | 275 | -17,17 | ||||
| 2025-11-14 | 13F | Gallagher Fiduciary Advisors, LLC | 1.634 | -31,03 | 292 | 8,96 | ||||
| 2025-08-26 | NP | TSWMX - TSW Emerging Markets Fund Advisor Shares | 9.800 | -55,45 | 137 | -62,36 | ||||
| 2026-01-23 | 13F | BSW Wealth Partners | 2.179 | -0,55 | 319 | -18,41 | ||||
| 2026-02-13 | 13F | Umb Bank N A/mo | 2.450 | 0,57 | 359 | -17,47 | ||||
| 2026-02-11 | 13F | IvyRock Asset Management (HK) Ltd | 96.700 | -12,80 | 14.174 | -28,49 | ||||
| 2025-11-13 | 13F | Quantitative Investment Management, LLC | 3.040 | 1 | ||||||
| 2026-01-16 | 13F | Crewe Advisors LLC | 7 | 0,00 | 1 | 0,00 | ||||
| 2026-02-12 | 13F | AI-Squared Management Ltd | 0 | -100,00 | 0 | |||||
| 2026-02-12 | 13F | Adviser Investments LLC | 55.480 | 102,29 | 8.132 | 65,93 | ||||
| 2026-02-04 | 13F | Tsfg, Llc | 135 | -6,90 | 0 | |||||
| 2025-08-26 | NP | BlackRock Capital Allocation Trust This fund is a listed as child fund of BlackRock, Inc. and if that institution has disclosed ownership in this security, then these positions will not be double counted when calculating total shares and total value | 5.334 | -2,56 | 605 | -16,46 | ||||
| 2026-02-12 | 13F | Ankerstar Wealth, LLC | 1.808 | 265 | ||||||
| 2026-01-07 | 13F | Vigilare Wealth Management | 0 | -100,00 | 0 | |||||
| 2026-02-13 | 13F | Platform Technology Partners | 0 | -100,00 | 0 | |||||
| 2026-02-12 | 13F | Triumph Capital Management | 256 | -40,19 | 38 | -51,32 | ||||
| 2026-02-13 | 13F | Causeway Capital Management Llc | 1.203.049 | -2,31 | 176.343 | -19,88 | ||||
| 2025-11-14 | 13F | Gluskin Sheff & Assoc Inc | 0 | -100,00 | 0 | -100,00 | ||||
| 2025-08-14 | 13F | Caisse De Depot Et Placement Du Quebec | 0 | -100,00 | 0 | -100,00 | ||||
| 2026-02-12 | 13F | Raiffeisen Bank International AG | 114.570 | 34,05 | 16.883 | 9,80 | ||||
| 2026-02-05 | 13F | Proactive Wealth Strategies LLC | 2.039 | 0,05 | 299 | -18,13 | ||||
| 2025-11-17 | 13F | Connective Capital Management, LLC | 11.778 | 2.105 | ||||||
| 2025-08-27 | NP | VHCOX - Vanguard Capital Opportunity Fund Investor Shares | 3.602.376 | -5,11 | 408.545 | -18,62 | ||||
| 2026-01-15 | 13F | Burns Matteson Capital Management, LLC | 1.412 | 207 | ||||||
| 2025-12-05 | 13F/A | Nwi Management Lp | 45.000 | 0,00 | 8 | 60,00 | ||||
| 2025-10-30 | 13F | Traub Capital Management LLC | 0 | -100,00 | 0 | -100,00 | ||||
| 2026-01-13 | 13F | Guerra Pan Advisors, Llc | 4.633 | 0,00 | 679 | -18,00 | ||||
| 2026-02-11 | 13F | Hughes Financial Services, LLC | 4 | 0,00 | 1 | |||||
| 2026-01-07 | 13F | Harbor Investment Advisory, Llc | 67.297 | 0,41 | 289 | 0,00 | ||||
| 2026-01-16 | 13F | Genesis Financial Group, LLC | 11.055 | 1.620 | ||||||
| 2025-08-26 | NP | UEMPX - UBS Emerging Markets Equity Opportunity Fund CLASS P | 61.076 | 6,66 | 6.927 | -8,53 | ||||
| 2025-11-12 | 13F | Taikang Asset Management (Hong Kong) Co Ltd | 272.841 | 60,49 | 48.765 | 152,94 | ||||
| 2025-11-13 | 13F | Beaird Harris Wealth Management, LLC | 11 | 37,50 | 2 | |||||
| 2026-01-05 | 13F | Park Avenue Securities Llc | 13.396 | -28,23 | 2 | -66,67 | ||||
| 2026-02-03 | 13F | RD Finance Ltd | 24.850 | 4 | ||||||
| 2026-02-13 | 13F | Lord, Abbett & Co. Llc | 0 | -100,00 | 0 | |||||
| 2026-02-10 | 13F | Fideuram Asset Management (Ireland) dac | 7.700 | 1.076 | ||||||
| 2026-02-13 | 13F | Bridgefront Capital, LLC | 3.599 | 194,04 | 528 | 141,74 | ||||
| 2026-02-06 | 13F | Mizuho Markets Americas Llc | Put | 54.557 | -41,28 | 3.247 | 17,64 | |||
| 2026-02-11 | 13F | Cookson Peirce & Co Inc | 12.420 | 1.821 | ||||||
| 2026-02-06 | 13F | Mizuho Markets Americas Llc | Call | 54.557 | -41,28 | 19.002 | 131,10 | |||
| 2025-08-27 | NP | SWRLX - Touchstone International Equity Fund Class A | 138.100 | -12,65 | 1.955 | -25,28 | ||||
| 2026-02-13 | 13F | Verition Fund Management LLC | Put | 363.000 | 53.209 | |||||
| 2026-02-13 | 13F | Verition Fund Management LLC | 342.895 | 50.262 | ||||||
| 2025-08-27 | NP | Advanced Series Trust - Ast Advanced Strategies Portfolio | 17.270 | 25,36 | 1.959 | 7,52 | ||||
| 2026-01-26 | 13F | Means Investment Co., Inc. | 15.360 | -0,95 | 2.251 | -18,77 | ||||
| 2025-09-26 | NP | FOKFX - Fidelity OTC K6 Portfolio This fund is a listed as child fund of Fmr Llc and if that institution has disclosed ownership in this security, then these positions will not be double counted when calculating total shares and total value | 529 | -1,31 | 64 | -1,56 | ||||
| 2026-02-09 | 13F | Hartland & Co., LLC | 2.076 | -34,12 | 304 | -46,00 | ||||
| 2025-08-14 | 13F | QVT Financial LP | 0 | -100,00 | 0 | -100,00 | ||||
| 2026-02-10 | 13F | Peapack Gladstone Financial Corp | 4.921 | 31,82 | 1 | |||||
| 2026-01-20 | 13F | Trust Co Of Toledo Na /oh/ | 160 | 0,00 | 23 | -17,86 | ||||
| 2025-09-26 | NP | PASIX - PACE Alternative Strategies Investments Class A | Short | -10.983 | 1,60 | -1.325 | 2,56 | |||
| 2026-02-12 | 13F | Lansforsakringar Fondforvaltning AB (publ) | 13.509 | 59,42 | 1.980 | 30,78 | ||||
| 2026-01-14 | 13F | Woodward Diversified Capital, Llc | 9.842 | 25,18 | 1.443 | 2,63 | ||||
| 2026-02-10 | 13F | Godfrey Financial Associates, Inc. | 10 | 1 | ||||||
| 2025-11-13 | 13F | BTG Pactual Asset Management US LLC | 6.710 | 1.199 | ||||||
| 2025-11-13 | 13F | Hsbc Holdings Plc | 8.020.518 | -2,99 | 1.435.147 | 52,97 | ||||
| 2025-11-13 | 13F | Hsbc Holdings Plc | Call | 156.700 | 28,44 | 28.120 | 102,08 | |||
| 2025-11-13 | 13F | Hsbc Holdings Plc | Put | 186.800 | -22,04 | 33.290 | 23,01 | |||
| 2026-02-11 | 13F | Sunrise Financial Services, LLC | 70 | 10 | ||||||
| 2026-02-09 | 13F | William Blair Investment Management, Llc | 11.067 | 1.622 | ||||||
| 2026-01-13 | 13F | Mayflower Financial Advisors, LLC | 2.157 | -21,99 | 316 | -36,03 | ||||
| 2025-08-26 | NP | Franklin Templeton Variable Insurance Products Trust - Templeton Developing Markets Vip Fund Class 1 | 1.110 | 0,00 | 126 | -14,38 | ||||
| 2026-02-10 | 13F | Bruce G. Allen Investments, LLC | 289 | -4,30 | 42 | -20,75 | ||||
| 2025-11-03 | 13F | Scion Asset Management, LLC | Call | 0 | -100,00 | 0 | -100,00 | |||
| 2026-02-13 | 13F | Truvestments Capital Llc | 70 | 0,00 | 10 | -16,67 | ||||
| 2025-08-14 | 13F | Rokos Capital Management LLP | Call | 0 | -100,00 | 0 | -100,00 | |||
| 2026-02-12 | 13F | Caerus Investment Advisors, LLC | 0 | -100,00 | 0 | |||||
| 2026-02-10 | 13F | Argent Trust Co | 4.533 | -16,44 | 664 | -31,48 | ||||
| 2025-11-14 | 13F | 3G Capital Partners LP | 20.000 | 3.575 | ||||||
| 2026-01-23 | 13F | Bellevue Asset Management, Llc | 100 | 0,00 | 15 | -17,65 | ||||
| 2026-02-12 | 13F | M&G Plc | 228.645 | 8,87 | 33.611 | -10,59 | ||||
| 2025-08-27 | NP | SEASONS SERIES TRUST - SA Putnam Asset Allocation Diversified Growth Portfolio Class 1 | 317 | 0,63 | 36 | -14,63 | ||||
| 2025-08-27 | NP | Advanced Series Trust - Ast Academic Strategies Asset Allocation Portfolio | 7.136 | 31,68 | 809 | 12,99 | ||||
| 2026-02-06 | 13F | Vestmark Advisory Solutions, Inc. | 20.775 | 34,29 | 3.045 | 10,13 | ||||
| 2025-11-13 | 13F | Monolith Management Ltd | 180.778 | 32.310 | ||||||
| 2026-01-13 | 13F | Avaii Wealth Management, Llc | 4.317 | -6,38 | 633 | -23,30 | ||||
| 2026-02-13 | 13F | Pathstone Holdings, LLC | 33.916 | -4,02 | 4.983 | -20,68 | ||||
| 2025-10-29 | 13F | CALIFORNIA FIRST LEASING Corp | 4.900 | 0,00 | 876 | 57,66 | ||||
| 2026-01-26 | 13F | Provenance Wealth Advisors, LLC | 221 | 0,00 | 32 | -17,95 | ||||
| 2026-01-22 | 13F | Financial Consulate, Inc | 528 | 3,53 | 77 | -15,38 | ||||
| 2025-09-25 | NP | TOUS - T. Rowe Price International Equity ETF | 282.568 | 1.636,42 | 4.248 | 118,63 | ||||
| 2026-02-13 | 13F | Icon Wealth Advisors, LLC | 0 | -100,00 | 0 | |||||
| 2025-11-14 | 13F | Northern Trust Corp | 1.743.807 | 8,00 | 311.671 | 70,21 | ||||
| 2025-09-25 | NP | GAOAX - JPMorgan Global Allocation Fund Class A | 2.579 | -81,39 | 311 | -88,50 | ||||
| 2026-01-29 | 13F | Dunhill Financial, LLC | 47 | -85,22 | 10 | -82,14 | ||||
| 2026-01-06 | 13F | Nelson, Van Denburg & Campbell Wealth Management Group, LLC | 2.203 | 12,86 | 323 | -7,47 | ||||
| 2025-08-14 | 13F | BTG Pactual Asset Management US LLC | Put | 0 | -100,00 | 0 | -100,00 | |||
| 2026-02-09 | 13F | Severin Investments, LLC | 2.762 | 405 | ||||||
| 2026-02-06 | 13F | Cullen/frost Bankers, Inc. | 334 | 153,03 | 49 | 108,70 | ||||
| 2026-02-12 | 13F | Intesa Sanpaolo Wealth Management | 22.683 | 3.325 | ||||||
| 2025-11-14 | 13F | Nomura Holdings Inc | Call | 309.200 | 55,30 | 55.263 | 144,75 | |||
| 2026-02-13 | 13F | Cornerstone Financial Management LLC | 73 | 11 | ||||||
| 2025-11-14 | 13F | Nomura Holdings Inc | Put | 324.100 | 980,33 | 57.926 | 1.602,70 | |||
| 2026-02-09 | 13F | Arnhold LLC | 150.736 | 0,00 | 22.095 | -17,99 | ||||
| 2026-01-26 | 13F | Foster Victor Wealth Advisors, LLC | 2.328 | 19,57 | 385 | 5,19 | ||||
| 2025-11-13 | 13F | Pacific Center for Financial Services | 611 | 0,00 | 109 | 57,97 | ||||
| 2025-09-25 | NP | abrdn Funds - abrdn Emerging Markets Dividend Active ETF | 16.080 | -9,68 | 1.940 | -8,80 | ||||
| 2025-08-14 | 13F | Archon Partners LLC | 0 | -100,00 | 0 | -100,00 | ||||
| 2026-01-15 | 13F | Independent Investors Inc | 10.100 | 0,00 | 1.480 | -18,01 | ||||
| 2026-02-12 | 13F | Xponance, Inc. | 4.937 | 3,22 | 724 | -15,34 | ||||
| 2026-02-05 | 13F | Atria Investments Llc | 39.552 | 18,63 | 5.797 | -2,72 | ||||
| 2026-01-28 | 13F | Rockingstone Advisors LLC | 1.930 | -2,03 | 283 | -19,89 | ||||
| 2026-02-06 | 13F | Mizuho Markets Americas Llc | 54.557 | -41,28 | 7.997 | -51,85 | ||||
| 2026-02-12 | 13F | Foster Dykema Cabot & Partners, Llc | 0 | -100,00 | 0 | |||||
| 2026-02-09 | 13F | Knights of Columbus Asset Advisors LLC | 2.594 | 0,00 | 380 | -17,93 | ||||
| 2025-11-14 | 13F | Caption Management, LLC | Call | 75.000 | 0,00 | 13.405 | 57,60 | |||
| 2025-11-14 | 13F | Caption Management, LLC | 33.500 | 5.987 | ||||||
| 2026-02-11 | 13F | LPL Financial LLC | Call | 4.600 | 674 | |||||
| 2026-01-20 | 13F | Thurston, Springer, Miller, Herd & Titak, Inc. | 52 | -88,29 | 8 | -91,14 | ||||
| 2026-02-11 | 13F | LPL Financial LLC | Put | 16.500 | 117,11 | 2.419 | 78,06 | |||
| 2026-02-12 | 13F | Keystone Financial Services | 1.445 | -0,82 | 212 | -18,85 | ||||
| 2025-08-20 | NP | WICGX - William Blair China Growth Fund Class I | 0 | -100,00 | 0 | -100,00 | ||||
| 2025-08-18 | NP | PACIFIC SELECT FUND - Focused Growth Portfolio Class I | 0 | -100,00 | 0 | -100,00 | ||||
| 2025-08-14 | 13F | BTG Pactual Asset Management US LLC | Call | 0 | -100,00 | 0 | -100,00 | |||
| 2026-02-11 | 13F | LPL Financial LLC | 635.179 | 1,42 | 93.104 | -16,82 | ||||
| 2025-11-10 | 13F | Greenland Capital Management LP | 0 | -100,00 | 0 | -100,00 | ||||
| 2025-09-24 | NP | BLACKROCK ASIAN DRAGON FUND, INC. - BLACKROCK ASIAN DRAGON FUND, INC. Investor A This fund is a listed as child fund of BlackRock, Inc. and if that institution has disclosed ownership in this security, then these positions will not be double counted when calculating total shares and total value | 5.948 | -12,31 | 718 | -11,48 | ||||
| 2025-11-14 | 13F | Biglari, Sardar | 7.750 | 0,00 | 1.385 | 57,74 | ||||
| 2025-11-14 | 13F | Steamboat Capital Partners, LLC | 7.896 | -58,16 | 1.411 | -34,07 | ||||
| 2026-02-13 | 13F | AlTi Global, Inc. | 12.994 | 16,85 | 1.905 | -4,18 | ||||
| 2025-11-14 | 13F | KADENSA CAPITAL Ltd | 359.919 | -28,70 | 64.328 | 12,36 | ||||
| 2026-02-09 | 13F | Powell Investment Advisors, LLC | 3.500 | 0,00 | 513 | -17,92 | ||||
| 2025-08-14 | 13F | Penn Mutual Asset Management, LLC | 0 | -100,00 | 0 | -100,00 | ||||
| 2026-01-20 | 13F | Caledonia Investments Plc | 278.000 | 0,00 | 40.738 | -17,99 | ||||
| 2025-08-26 | NP | IJEAX - VY(R) JPMorgan Emerging Markets Equity Portfolio Class ADV | 45.920 | 20,85 | 5.208 | 3,64 | ||||
| 2026-02-11 | 13F | EULAV Asset Management | 43.000 | 22,86 | 6.303 | 0,75 | ||||
| 2026-01-16 | 13F | Standard Life Aberdeen plc | 34.593 | 45,62 | 5.071 | 18,65 | ||||
| 2025-09-29 | NP | AWWIX - CIBC ATLAS INTERNATIONAL GROWTH FUND Institutional Class Shares | 49.946 | 0,00 | 6.025 | 0,99 | ||||
| 2025-11-14 | 13F | Jain Global LLC | 0 | -100,00 | 0 | |||||
| 2026-02-13 | 13F | Bollard Group LLC | 1.937 | 0 | ||||||
| 2025-11-14 | 13F | KEYWISE CAPITAL MANAGEMENT (HK) Ltd | Call | 28.000 | 5.004 | |||||
| 2026-02-13 | 13F | TFB Advisors LLC | 3.729 | 23,03 | 547 | 10,75 | ||||
| 2025-09-23 | NP | VVIFX - Voya VACS Series EME Fund | 29.759 | 54,99 | 3.590 | 56,52 | ||||
| 2026-01-14 | 13F | Wolff Wiese Magana Llc | 621 | -7,45 | 91 | -23,53 | ||||
| 2025-08-14 | 13F | Ubs Oconnor Llc | 0 | -100,00 | 0 | -100,00 | ||||
| 2026-01-28 | 13F | Hudson Value Partners, LLC | 23.339 | 58,67 | 3.438 | 30,78 | ||||
| 2025-12-09 | 13F | Painted Porch Advisors LLC | 71 | 0,00 | 13 | 50,00 | ||||
| 2026-02-11 | 13F | OPTIMAS CAPITAL Ltd | 25.400 | -76,41 | 3.723 | -80,66 | ||||
| 2026-01-12 | 13F | Focus Financial Network, Inc. | 8.390 | -5,45 | 1.230 | -22,51 | ||||
| 2025-08-26 | NP | EQ ADVISORS TRUST - EQ/International Core Managed Volatility Portfolio Class IB | 5.087 | -30,12 | 577 | -40,12 | ||||
| 2025-11-14 | 13F | Discovery Capital Management, Llc / Ct | 19.400 | -87,56 | 3.467 | -80,40 | ||||
| 2025-08-27 | NP | TIQIX - Touchstone Global ESG Equity Fund Class Y | 156.192 | 134,24 | 17.714 | 100,90 | ||||
| 2026-02-13 | 13F | Harber Asset Management Llc | 47.127 | 0,00 | 6.908 | -18,00 | ||||
| 2025-08-27 | NP | ICHKX - Guinness Atkinson China & Hong Kong Fund | 4.201 | -82,85 | 476 | 37,57 | ||||
| 2026-02-10 | 13F | DT Investment Partners, LLC | 75 | 11 | ||||||
| 2025-09-26 | NP | FTCEX - Fidelity Total International Equity Fund Fidelity Advisor Total International Equity Fund: Class C This fund is a listed as child fund of Fmr Llc and if that institution has disclosed ownership in this security, then these positions will not be double counted when calculating total shares and total value | 23.389 | -44,49 | 2.821 | -43,94 | ||||
| 2026-02-05 | 13F | Center for Financial Planning, Inc. | 192 | 0,00 | 28 | -17,65 | ||||
| 2026-01-08 | 13F | Sanders Morris Harris Llc | 19.170 | 2.890 | ||||||
| 2025-11-14 | 13F | Moore Capital Management, Lp | Call | 320.900 | 57.354 | |||||
| 2026-02-13 | 13F | Peak6 Llc | Put | 277.900 | -70,84 | 40.735 | -76,09 | |||
| 2025-09-29 | NP | POGRX - PRIMECAP Odyssey Growth Fund | 918.353 | -10,79 | 110.781 | -9,90 | ||||
| 2026-02-13 | 13F | Peak6 Llc | 278.232 | 40.783 | ||||||
| 2025-11-14 | 13F | Anchor Investment Management, LLC | 425 | 325,00 | 76 | 581,82 | ||||
| 2026-02-13 | 13F | Peak6 Llc | Call | 612.800 | -62,18 | 89.824 | -68,98 | |||
| 2026-01-27 | 13F | Forum Financial Management, LP | 2.234 | 3,00 | 327 | -15,50 | ||||
| 2026-01-09 | 13F | Dynamic Advisor Solutions LLC | 2.486 | 2,47 | 364 | -15,94 | ||||
| 2026-02-06 | 13F | Lazard Freres Gestion S.A.S. | 1.625 | 0,00 | 0 | |||||
| 2025-11-14 | 13F | Altimeter Capital Management, LP | 969.100 | 173.207 | ||||||
| 2026-01-12 | 13F | Arkfeld Wealth Strategies, L.L.C. | 0 | -100,00 | 0 | -100,00 | ||||
| 2026-02-12 | 13F | BlackRock, Inc. | 3.817.181 | -30,17 | 559.522 | -42,73 | ||||
| 2026-01-30 | 13F | W.G. Shaheen & Associates DBA Whitney & Co | 0 | -100,00 | 0 | |||||
| 2026-02-12 | 13F | Longitude (Cayman) Ltd. | Call | 0 | -100,00 | 0 | ||||
| 2025-12-09 | 13F/A | Tudor Investment Corp Et Al | Put | 411.100 | 2.990,98 | 73.476 | 4.772,35 | |||
| 2025-09-25 | NP | WRAAX - Wilmington Global Alpha Equities Fund Class A Shares | 5.296 | -5,87 | 639 | -4,92 | ||||
| 2025-12-09 | 13F/A | Tudor Investment Corp Et Al | Call | 186.800 | -8,39 | 33.387 | 44,38 | |||
| 2026-01-28 | 13F | Migdal Insurance & Financial Holdings Ltd. | 288.498 | -0,16 | 42 | -17,65 | ||||
| 2025-12-09 | 13F/A | Tudor Investment Corp Et Al | 49.659 | 8.876 | ||||||
| 2026-02-09 | 13F | Wcm Investment Management, Llc | 55.789 | 80,73 | 8.221 | 48,05 | ||||
| 2026-01-20 | 13F | Savvy Advisors, Inc. | 6.430 | 8,05 | 942 | -11,38 | ||||
| 2025-11-14 | 13F | Mercer Global Advisors Inc /adv | 18.417 | -11,40 | 3.292 | 39,63 | ||||
| 2025-08-14 | 13F | Metavasi Capital LP | 0 | -100,00 | 0 | -100,00 | ||||
| 2026-02-09 | 13F | Frazier Financial Advisors, LLC | 0 | -100,00 | 0 | |||||
| 2026-02-13 | 13F | Thornburg Investment Management Inc | 584.028 | 5,54 | 85.607 | -13,45 | ||||
| 2025-11-14 | 13F | Beaconlight Capital, Llc | 21.489 | 3.841 | ||||||
| 2026-02-12 | 13F | Polen Capital Management Llc | 0 | -100,00 | 0 | |||||
| 2025-09-29 | NP | RGEF - Rockefeller Global Equity ETF | 64.142 | 14,42 | 7.737 | 15,56 | ||||
| 2026-01-14 | 13F | Wincap Financial Llc | 8.568 | -0,76 | 1.256 | -18,66 | ||||
| 2026-02-13 | 13F | Citigroup Inc | 2.844.328 | 30,44 | 416.922 | 6,98 | ||||
| 2026-02-06 | 13F | Mach-1 Financial Group, Inc. | 0 | -100,00 | 0 | |||||
| 2026-02-13 | 13F | Cladis Investment Advisory, LLC | 0 | -100,00 | 0 | |||||
| 2026-01-07 | 13F | Lake Hills Wealth Management, LLC | 1.914 | -43,62 | 281 | -53,80 | ||||
| 2026-02-13 | 13F | Citigroup Inc | Call | 986.300 | 24,80 | 144.572 | 2,35 | |||
| 2026-02-13 | 13F | Citigroup Inc | Put | 873.300 | 1,99 | 128.008 | -16,36 | |||
| 2025-08-28 | NP | DODFX - Dodge & Cox International Stock Fund | 7.754.700 | 0,00 | 879.461 | -14,23 | ||||
| 2026-01-28 | 13F | One River Asset Management, LLC | Call | 14.000 | 2.061 | |||||
| 2025-08-21 | NP | MXEBX - Great-West Core Strategies: U.S. Equity Fund Institutional Class | 4.871 | 1,99 | 552 | -12,52 | ||||
| 2025-08-21 | NP | MXLGX - Great-West Large Cap Growth Fund Investor Class | 61.063 | -0,29 | 6.925 | -14,47 | ||||
| 2026-02-13 | 13F | Infusive Asset Management Inc. | 46.570 | -24,30 | 6.826 | -37,91 | ||||
| 2025-11-13 | 13F | GeoWealth Management, LLC | 1.717 | 86,23 | 307 | 194,23 | ||||
| 2025-08-22 | NP | Fidelity Central Investment Portfolios LLC - Fidelity Emerging Markets Equity Central Fund This fund is a listed as child fund of Fmr Llc and if that institution has disclosed ownership in this security, then these positions will not be double counted when calculating total shares and total value | 83.000 | 70,08 | 9.413 | 45,89 | ||||
| 2025-10-21 | 13F | Clay Northam Wealth Management, LLC | 4.869 | -2,99 | 870 | 52,90 | ||||
| 2025-11-14 | 13F | Melqart Asset Management (uk) Ltd | 80.311 | 14.354 | ||||||
| 2025-11-14 | 13F | Clark Capital Management Group, Inc. | 290.459 | -17,50 | 51.914 | 30,02 | ||||
| 2025-08-21 | NP | LZOEX - Lazard Emerging Markets Equity Portfolio Open Shares | 0 | -100,00 | 0 | -100,00 | ||||
| 2025-08-26 | NP | EQ ADVISORS TRUST - EQ/Lazard Emerging Markets Equity Portfolio Class IB | 0 | -100,00 | 0 | -100,00 | ||||
| 2026-01-22 | 13F | Intergy Private Wealth, LLC | 1.636 | 7,00 | 240 | -12,45 | ||||
| 2026-02-10 | 13F | Intellectus Partners, LLC | 22.428 | -17,02 | 3.287 | -31,95 | ||||
| 2025-08-25 | NP | ROBT - First Trust Nasdaq Artificial Intelligence and Robotics ETF This fund is a listed as child fund of First Trust Advisors Lp and if that institution has disclosed ownership in this security, then these positions will not be double counted when calculating total shares and total value | 18.284 | 18,50 | 2.074 | 1,62 | ||||
| 2025-08-21 | NP | LAZARD RETIREMENT SERIES INC - Lazard Retirement Emerging Markets Equity Portfolio Service Shares | 0 | -100,00 | 0 | -100,00 | ||||
| 2026-02-06 | 13F | McKinley Carter Wealth Services, Inc. | 1.811 | -0,93 | 265 | -18,71 | ||||
| 2026-01-27 | 13F | Osborne Partners Capital Management, Llc | 107.814 | -3,66 | 15.803 | -20,99 | ||||
| 2026-01-28 | 13F | DekaBank Deutsche Girozentrale | 71.870 | 0,00 | 6 | -53,85 | ||||
| 2026-02-13 | 13F | Sands Capital Management, Llc | 7.511 | 1.101 | ||||||
| 2025-08-27 | NP | IASMX - Guinness Atkinson Asia Focus Fund | 600 | -97,35 | 68 | -78,68 | ||||
| 2026-01-26 | 13F | Private Trust Co Na | 4.077 | -0,29 | 598 | -18,22 | ||||
| 2025-12-15 | 13F | Ctc Llc | Put | 27.025 | -99,13 | 483.018 | 37,42 | |||
| 2026-01-30 | 13F | Interchange Capital Partners, LLC | 5.455 | 1,00 | 800 | -17,20 | ||||
| 2026-02-03 | 13F | Farmers & Merchants Investments Inc | 487 | 0,00 | 71 | -18,39 | ||||
| 2025-12-15 | 13F | Ctc Llc | 239.839 | -57,78 | 42.866 | -33,46 | ||||
| 2025-11-14 | 13F | Advisor Group Holdings, Inc. | 262.977 | 6,16 | 41.052 | 42,53 | ||||
| 2025-08-22 | NP | CZMGX - Multi-Manager Growth Strategies Fund Institutional Class | 3.397 | -98,19 | 385 | -98,45 | ||||
| 2026-01-12 | 13F | Seacrest Wealth Management, Llc | 0 | -100,00 | 0 | |||||
| 2025-12-15 | 13F | Ctc Llc | Call | 40.868 | -99,04 | 730.434 | 51,03 | |||
| 2026-02-12 | 13F | Longitude (Cayman) Ltd. | 5.000 | 733 | ||||||
| 2026-01-13 | 13F | Stephens Consulting, LLC | 15 | 0,00 | 2 | 0,00 | ||||
| 2026-02-05 | 13F | Eubel Brady & Suttman Asset Management Inc | 2.032 | 0,00 | 0 | |||||
| 2025-08-26 | NP | BlackRock ESG Capital Allocation Trust This fund is a listed as child fund of BlackRock, Inc. and if that institution has disclosed ownership in this security, then these positions will not be double counted when calculating total shares and total value | 1.683 | 191 | ||||||
| 2026-01-28 | 13F | UG Investment Advisers Ltd. | 1.359.363 | -12,67 | 199.255 | -28,38 | ||||
| 2025-11-14 | 13F | Ameriprise Financial Inc | 356.127 | -26,54 | 63.726 | 16,02 | ||||
| 2026-02-03 | 13F | Maxi Investments CY Ltd | 78.400 | 292,00 | 11 | 266,67 | ||||
| 2026-02-06 | 13F | Griffin Asset Management, Inc. | 0 | -100,00 | 0 | |||||
| 2025-08-14 | 13F | Optiver Holding B.V. | Put | 0 | -100,00 | 0 | -100,00 | |||
| 2025-09-09 | NP | China Fund Inc | 595.408 | 3,05 | 8.842 | 1,53 | ||||
| 2026-01-29 | 13F | Financial Life Planners | 0 | -100,00 | 0 | |||||
| 2026-02-04 | 13F | Valeo Financial Advisors, LLC | 4.906 | -2,74 | 719 | -20,20 | ||||
| 2025-11-10 | 13F | Dearborn Partners Llc | 0 | -100,00 | 0 | |||||
| 2025-09-24 | NP | AAARX - Strategic Allocation: Aggressive Fund R Class This fund is a listed as child fund of American Century Companies Inc and if that institution has disclosed ownership in this security, then these positions will not be double counted when calculating total shares and total value | 3.864 | 0,00 | 466 | 1,08 | ||||
| 2026-02-03 | 13F | RFG Advisory, LLC | 3.274 | 7,49 | 480 | -11,95 | ||||
| 2026-02-02 | 13F | Avidian Wealth Solutions, LLC | 6.443 | 4,41 | 944 | -14,34 | ||||
| 2026-02-12 | 13F | SWAN Capital LLC | 36 | 0,00 | 5 | -16,67 | ||||
| 2026-02-10 | 13F | Natixis Advisors, L.p. | 199.154 | -19,97 | 29 | -34,09 | ||||
| 2026-01-13 | 13F | Dakota Wealth Management | 0 | -100,00 | 0 | |||||
| 2025-08-26 | NP | BLCN - Siren Nasdaq NexGen Economy ETF | 3.737 | 83,55 | 424 | 57,25 | ||||
| 2026-02-13 | 13F | Rhumbline Advisers | 7.798 | -14,66 | 1.143 | -30,01 | ||||
| 2026-02-12 | 13F | Insigneo Advisory Services, Llc | 19.124 | -27,27 | 2.803 | -40,35 | ||||
| 2026-02-13 | 13F | Patient Capital Management, LLC | 0 | -100,00 | 0 | |||||
| 2026-02-13 | 13F | Banco Santander, S.A. | 43.145 | 22,66 | 6.324 | 0,60 | ||||
| 2026-01-22 | 13F | Personal Cfo Solutions, Llc | 2.976 | 94,13 | 436 | 59,12 | ||||
| 2026-02-02 | 13F | Strs Ohio | 373.807 | -19,66 | 54.793 | -34,11 | ||||
| 2025-08-21 | NP | TEKY - Lazard Next Gen Technologies ETF | 3.922 | 445 | ||||||
| 2026-02-13 | 13F | Polymer Capital Management (HK) LTD | 16.103 | -84,94 | 2.360 | -87,65 | ||||
| 2026-02-02 | 13F | Nkcfo Llc | 13.800 | -33,65 | 2 | -33,33 | ||||
| 2026-02-03 | 13F | Wilson Asset Management (international) Pty Ltd | 63.338 | 20,17 | 9.284 | -1,43 | ||||
| 2026-02-12 | 13F | Barings Llc | 10.195 | 1.494 | ||||||
| 2025-12-03 | 13F | Strategic Investment Solutions, Inc. /IL | 201 | -19,92 | 36 | 25,00 | ||||
| 2026-02-02 | 13F | Mutual Advisors, LLC | 4.208 | -34,47 | 617 | -44,15 | ||||
| 2026-02-02 | 13F | Summit Place Financial Advisors, LLC | 2.570 | 0,00 | 377 | -18,08 | ||||
| 2026-02-11 | 13F | West Family Investments, Inc. | 10.267 | -1,67 | 1.505 | -19,40 | ||||
| 2025-08-27 | NP | JNL SERIES TRUST - JNL Multi-Manager Alternative Fund (A) | 21.129 | 0,00 | 2.396 | -14,21 | ||||
| 2025-08-28 | NP | FSMSX - FS Multi-Strategy Alternatives Fund Class I | Short | -35.130 | -3.984 | |||||
| 2025-11-04 | 13F | Jones Financial Companies Lllp | 35.431 | 18,33 | 6.091 | 78,33 | ||||
| 2026-01-26 | 13F | KBC Group NV | 25.374 | 1,50 | 4 | -25,00 | ||||
| 2025-11-14 | 13F | Creative Planning | 234.911 | 14,79 | 41.986 | 80,91 | ||||
| 2026-02-13 | 13F | Templeton & Phillips Capital Management, LLC | 0 | -100,00 | 0 | |||||
| 2026-02-13 | 13F | Davis Asset Management, L.P. | 500.000 | 0,00 | 73.290 | -17,99 | ||||
| 2025-08-26 | NP | NOEMX - Northern Emerging Markets Equity Index Fund | 3.651.680 | -1,22 | 51.823 | -15,46 | ||||
| 2025-11-14 | 13F | Shay Capital LLC | 30.000 | -52,76 | 5.362 | -25,55 | ||||
| 2025-11-14 | 13F | Shay Capital LLC | Call | 46.000 | -91,19 | 8.222 | -86,11 | |||
| 2026-01-26 | 13F | Quadrant Private Wealth Management, LLC | 11.308 | 1,30 | 1.658 | -16,94 | ||||
| 2026-02-11 | 13F | Holowesko Partners Ltd. | 95.100 | 0,00 | 13.940 | -17,99 | ||||
| 2025-08-14 | 13F | Kora Management LP | 0 | -100,00 | 0 | -100,00 | ||||
| 2026-01-12 | 13F | Abound Wealth Management | 86 | 377,78 | 13 | 300,00 | ||||
| 2026-02-09 | 13F | Hantz Financial Services, Inc. | 68.735 | 15,07 | 10 | 0,00 | ||||
| 2026-02-10 | 13F/A | Northwestern Mutual Wealth Management Co | 77.097 | -0,26 | 11.301 | -18,20 | ||||
| 2026-02-13 | 13F | Morgan Stanley | 5.445.261 | 7,97 | 798.167 | -11,45 | ||||
| 2025-11-13 | 13F | Fmr Llc | 11.966.783 | 30,83 | 2.138.823 | 106,19 | ||||
| 2026-01-29 | 13F | China Universal Asset Management Co., Ltd. | 22.282 | -27,94 | 3.266 | -40,90 | ||||
| 2025-11-10 | 13F | Atomi Financial Group, Inc. | 27.389 | 11,62 | 4.895 | 75,95 | ||||
| 2026-02-02 | 13F | Principal Financial Group Inc | 8.734 | -20,78 | 1.280 | -35,03 | ||||
| 2026-02-12 | 13F | Elevated Private Wealth, LLC | 5.718 | 838 | ||||||
| 2026-02-13 | 13F | Y-Intercept (Hong Kong) Ltd | 68.620 | 10.058 | ||||||
| 2025-08-28 | NP | DGT - SPDR(R) Global Dow ETF This fund is a listed as child fund of State Street Corp and if that institution has disclosed ownership in this security, then these positions will not be double counted when calculating total shares and total value | 19.652 | 20,85 | 2.229 | 3,63 | ||||
| 2025-08-15 | 13F | E Fund Management Co., Ltd. | 0 | -100,00 | 0 | -100,00 | ||||
| 2025-08-27 | NP | Advanced Series Trust - Ast Capital Growth Asset Allocation Portfolio | 22.541 | 19,44 | 2.556 | 2,44 | ||||
| 2026-01-29 | 13F | Kestra Private Wealth Services, Llc | 16.626 | -9,36 | 2.437 | -25,66 | ||||
| 2025-08-22 | NP | CLCEX - Multi-Manager Large Cap Growth Strategies Fund Institutional Class | 141.828 | 16.085 | ||||||
| 2026-02-03 | 13F | Koshinski Asset Management, Inc. | 2.200 | 5,87 | 322 | -13,21 | ||||
| 2026-01-27 | 13F | Meritage Portfolio Management | 131.873 | -2,67 | 19.330 | -20,18 | ||||
| 2026-02-13 | 13F | Arrowstreet Capital, Limited Partnership | 106.225 | -49,16 | 15.570 | -58,31 | ||||
| 2026-01-22 | 13F | Venturi Wealth Management, LLC | 2.953 | 15,17 | 433 | -5,68 | ||||
| 2026-02-12 | 13F | Callan Family Office, LLC | 17.548 | 313,58 | 2.572 | 239,31 | ||||
| 2026-01-27 | 13F | Zurcher Kantonalbank (Zurich Cantonalbank) | 17.794 | 13,15 | 2.608 | -7,19 | ||||
| 2025-09-25 | NP | QLVE - FlexShares Emerging Markets Quality Low Volatility Index Fund | 3.630 | -1,22 | 438 | -0,23 | ||||
| 2025-08-14 | 13F | Biglari Capital Corp. | 0 | -100,00 | 0 | -100,00 | ||||
| 2026-02-03 | 13F | Ballentine Partners, LLC | 15.674 | -1,96 | 2.297 | -19,60 | ||||
| 2026-02-12 | 13F | Penserra Capital Management LLC | 251.478 | 9,14 | 37 | -12,20 | ||||
| 2025-11-14 | 13F | Integrity Wealth Advisors, Inc. | 5.774 | 17,98 | 980 | 76,58 | ||||
| 2026-02-11 | 13F | Investors Towarzystwo Funduszy Inwestycyjnych Spolka Akcyjna | 1.495 | 219 | ||||||
| 2026-02-06 | 13F | GPS Wealth Strategies Group, LLC | 0 | -100,00 | 0 | |||||
| 2026-02-11 | 13F | Cypress Capital Group | 33.781 | -1,42 | 4.952 | -19,15 | ||||
| 2025-09-24 | NP | EMQAX - Ashmore Emerging Markets Active Equity Fund CLASS A | 28.600 | -57,31 | 422 | -58,11 | ||||
| 2025-11-14 | 13F | Consultiva Wealth Management, Corp. | 390 | 0,00 | 70 | 56,82 | ||||
| 2025-08-25 | NP | MMIUX - MassMutual Select T. Rowe Price International Equity Fund Class I | 1.722 | -92,90 | 195 | -93,91 | ||||
| 2026-02-06 | 13F/A | Rathbone Brothers plc | 67.687 | -0,21 | 9.922 | -18,16 | ||||
| 2026-01-14 | 13F | Woodstock Corp | 3.642 | 0,00 | 534 | -18,00 | ||||
| 2025-11-13 | 13F | Van Hulzen Asset Management, LLC | 0 | -100,00 | 0 | -100,00 | ||||
| 2026-01-15 | 13F | Nisa Investment Advisors, Llc | 986 | 3,79 | 145 | -14,79 | ||||
| 2026-02-11 | 13F | J.w. Cole Advisors, Inc. | 6.176 | -1,95 | 839 | -25,51 | ||||
| 2026-02-11 | 13F | Hilton Head Capital Partners, LLC | 470 | 69 | ||||||
| 2025-08-20 | NP | NATIONWIDE VARIABLE INSURANCE TRUST - NVIT Emerging Markets Fund Class I | 19.700 | -45,73 | 2.234 | -53,45 | ||||
| 2025-10-21 | 13F | Steel Peak Wealth Management LLC | 0 | -100,00 | 0 | |||||
| 2026-01-16 | 13F | Udine Wealth Management, Inc. | 14.155 | -4,17 | 2 | -99,92 | ||||
| 2025-12-29 | 13F | Cape Investment Advisory, Inc. | 460 | -61,21 | 82 | -38,81 | ||||
| 2025-11-20 | 13F | Maven Securities LTD | Call | 0 | -100,00 | 0 | ||||
| 2025-11-14 | 13F | Alphadyne Asset Management, LLC | Call | 0 | -100,00 | 0 | -100,00 | |||
| 2026-01-13 | 13F | CoreCap Advisors, LLC | 1.174 | -10,45 | 172 | -26,50 | ||||
| 2025-11-12 | 13F | CIBC Bancorp USA Inc. | 399.583 | 71.418 | ||||||
| 2025-11-14 | 13F | Alphadyne Asset Management, LLC | 0 | -100,00 | 0 | -100,00 | ||||
| 2025-11-14 | 13F | Cardiff Park Advisors, Llc | 2.297 | 0,00 | 411 | 57,69 | ||||
| 2025-11-14 | 13F | Rings Capital Management LLC | 7.100 | 0,00 | 1.269 | 57,52 | ||||
| 2025-11-19 | 13F | Auxier Asset Management | 9.476 | 0,82 | 1.694 | 58,97 | ||||
| 2026-01-29 | 13F | Quent Capital, LLC | Call | 200 | 29 | |||||
| 2026-01-29 | 13F | Quent Capital, LLC | 10 | 1 | ||||||
| 2026-02-13 | 13F | Cullen Capital Management, LLC | 42.462 | -7,01 | 6.224 | -23,73 | ||||
| 2026-01-29 | 13F | Nbc Securities, Inc. | Call | 0 | -100,00 | 0 | -100,00 | |||
| 2025-11-14 | 13F | D. E. Shaw & Co., Inc. | 1.416.814 | -68,13 | 253.227 | -49,78 | ||||
| 2026-01-14 | 13F | Cypress Wealth Services, LLC | 1.418 | 5,58 | 208 | -13,75 | ||||
| 2025-11-14 | 13F | D. E. Shaw & Co., Inc. | Call | 1.107.000 | -73,45 | 197.854 | -58,16 | |||
| 2025-08-28 | NP | BlackRock Variable Series Funds, Inc. - BlackRock Global Allocation V.I. Fund Class I This fund is a listed as child fund of BlackRock, Inc. and if that institution has disclosed ownership in this security, then these positions will not be double counted when calculating total shares and total value | 26.746 | -0,42 | 3.033 | -14,59 | ||||
| 2025-11-14 | 13F | D. E. Shaw & Co., Inc. | Put | 1.123.700 | -44,23 | 200.839 | -12,11 | |||
| 2026-01-12 | 13F | Kozak & Associates, Inc. | 2 | 0,00 | 0 | |||||
| 2026-02-13 | 13F | Mariner, LLC | 83.657 | 27,17 | 12.266 | 4,33 | ||||
| 2026-02-11 | 13F | Commonwealth Retirement Investments LLC | 94 | 14 | ||||||
| 2026-01-07 | 13F | Magnus Financial Group LLC | 11.304 | 7,41 | 1.657 | -11,91 | ||||
| 2026-01-12 | 13F | Perkins Coie Trust Co | 0 | -100,00 | 0 | |||||
| 2026-01-27 | 13F | Rainey & Randall Investment Management Inc. | 4.906 | 0,00 | 719 | -17,92 | ||||
| 2026-01-28 | 13F | Morton Brown Family Wealth, LLC | 150 | 0,00 | 22 | -19,23 | ||||
| 2026-01-22 | 13F/A | Cresset Asset Management, LLC | Put | 300 | 0,00 | 54 | 55,88 | |||
| 2025-09-25 | NP | VWNFX - Vanguard Windsor II Fund Investor Shares | 832.401 | 0,00 | 100.413 | 1,00 | ||||
| 2025-08-14 | 13F | Ancient Art, L.P. | 0 | -100,00 | 0 | -100,00 | ||||
| 2026-02-09 | 13F | Fidelis Capital Partners, LLC | 6.619 | 3,00 | 970 | -15,51 | ||||
| 2026-01-22 | 13F/A | Cresset Asset Management, LLC | 9.121 | -18,95 | 1.630 | 25,58 | ||||
| 2025-11-14 | 13F | Sig Brokerage, Lp | Call | 73.900 | 721,11 | 13.208 | 1.194,90 | |||
| 2025-11-17 | 13F | LGT Financial Advisors LLC | 0 | -100,00 | 0 | |||||
| 2026-01-13 | 13F | Mather Group, Llc. | 0 | -100,00 | 0 | |||||
| 2026-01-23 | 13F | High Net Worth Advisory Group LLC | 3.770 | -7,03 | 553 | -23,76 | ||||
| 2025-08-26 | NP | WCQGX - WCM China Quality Growth Fund Investor Class Shares | 230 | -71,60 | 26 | -75,70 | ||||
| 2025-08-29 | NP | JAKWX - John Hancock Disciplined Value Global Long/Short Fund Class NAV | 41.553 | 4.713 | ||||||
| 2026-02-11 | 13F | Ovata Capital Management Ltd | 102.096 | -29,03 | 15.867 | -39,40 | ||||
| 2026-01-28 | 13F | Oversea-Chinese Banking CORP Ltd | 7.927 | 220,80 | 1.177 | 177,59 | ||||
| 2026-02-04 | 13F | Fourth Dimension Wealth, LLC | 200 | 0,00 | 29 | -17,14 | ||||
| 2026-01-28 | 13F | Headland Capital, LLC | 2.500 | 3,99 | 366 | -14,69 | ||||
| 2025-11-14 | 13F | Axiom International Investors Llc /de | 0 | -100,00 | 0 | |||||
| 2025-09-26 | NP | PNQI - Invesco NASDAQ Internet ETF This fund is a listed as child fund of Invesco Ltd. and if that institution has disclosed ownership in this security, then these positions will not be double counted when calculating total shares and total value | 128.835 | -19,28 | 15.541 | -18,46 | ||||
| 2025-08-26 | NP | BlackRock Strategic Global Bond Fund, Inc. - BlackRock Strategic Global Bond Fund, Inc. Investor A This fund is a listed as child fund of BlackRock, Inc. and if that institution has disclosed ownership in this security, then these positions will not be double counted when calculating total shares and total value | 1.519 | -0,13 | 172 | -14,43 | ||||
| 2026-02-09 | 13F | Jefferies Financial Group Inc. | Put | 32.500 | 85,71 | 4.764 | 52,32 | |||
| 2025-11-14 | 13F | Sig Brokerage, Lp | Put | 82.500 | 4.025,00 | 14.745 | 6.424,34 | |||
| 2026-01-27 | 13F | Evergreen Capital Management Llc | 65.336 | -1,76 | 9.577 | -19,44 | ||||
| 2026-02-10 | 13F | IFG Advisory, LLC | 0 | -100,00 | 0 | |||||
| 2025-11-14 | 13F | Sig Brokerage, Lp | 20.345 | 137,76 | 3.636 | 274,85 | ||||
| 2026-02-10 | 13F | CIBC World Markets Inc. | 254.414 | 3,59 | 37.292 | -15,04 | ||||
| 2026-02-11 | 13F | Gordian Capital Singapore Pte Ltd | 893 | -89,96 | 131 | -91,82 | ||||
| 2026-02-13 | 13F | PCM Encore, LLC | 9.226 | 1.352 | ||||||
| 2026-02-13 | 13F | Sofos Investments, Inc. | 0 | -100,00 | 0 | |||||
| 2026-02-09 | 13F | Jefferies Financial Group Inc. | Call | 25.000 | -79,94 | 3.664 | -83,55 | |||
| 2025-11-14 | 13F | Engle Capital Management, L.P. | 48.500 | 8.668 | ||||||
| 2025-09-26 | NP | TEMRX - TIAA-CREF Emerging Markets Equity Fund Retail Class | 6.005.808 | 15,11 | 90.296 | 15,92 | ||||
| 2025-08-26 | NP | VDMCX - Virtus KAR Developing Markets Fund Class C | 279 | -51,39 | 32 | -58,67 | ||||
| 2026-02-09 | 13F | Jefferies Financial Group Inc. | 5.809 | 16,60 | 851 | -4,38 | ||||
| 2026-02-11 | 13F | Contrarius Group Holdings Ltd | 212.054 | 31.083 | ||||||
| 2026-01-20 | 13F | Ethos Financial Group, LLC | 1.424 | 209 | ||||||
| 2026-02-13 | 13F | Ubs Asset Management Americas Inc | 5.750.996 | -0,20 | 842.981 | -18,15 | ||||
| 2026-01-23 | 13F | Bridgewater Advisors Inc. | 4.535 | -0,04 | 765 | 0,53 | ||||
| 2026-02-13 | 13F | Botty Investors LLC | 17.850 | 0,00 | 2.616 | -17,99 | ||||
| 2026-01-16 | 13F | Trust Co Of Vermont | 15 | 2 | ||||||
| 2026-02-09 | 13F | Kingsview Wealth Management, LLC | 4.732 | -2,39 | 694 | -19,98 | ||||
| 2026-02-13 | 13F | Arete Wealth Advisors, LLC | 6.125 | -3,07 | 1 | -100,00 | ||||
| 2026-02-12 | 13F | Miller Financial Services LLC | 1.350 | 15,58 | 218 | 4,33 | ||||
| 2026-02-11 | 13F | Franklin Resources Inc | 58.365 | -49,62 | 8.555 | -58,68 | ||||
| 2025-10-17 | 13F | Chesapeake Asset Management Llc | Put | 0 | -100,00 | 0 | -100,00 | |||
| 2026-01-28 | 13F | Barrett & Company, Inc. | 100 | 0,00 | 15 | -17,65 | ||||
| 2026-02-03 | 13F | Orion Capital Management LLC | 1.000 | -1,09 | 147 | -18,89 | ||||
| 2026-02-11 | 13F | Vestor Capital, Llc | 269.961 | 205,44 | 0 | -100,00 | ||||
| 2026-02-13 | 13F | Chou Associates Management Inc. | 41.900 | 0,00 | 6.142 | -17,99 | ||||
| 2026-01-06 | 13F | Sanctuary Advisors, LLC | Call | 0 | -100,00 | 0 | -100,00 | |||
| 2025-08-28 | NP | Acap Strategic Fund | 803.126 | 91.083 | ||||||
| 2026-01-21 | 13F | Yousif Capital Management, Llc | 19.976 | -7,91 | 3.244 | -16,33 | ||||
| 2026-01-21 | 13F | Aaron Wealth Advisors LLC | 14.301 | 38,50 | 2.096 | 13,60 | ||||
| 2026-02-03 | 13F | Cheviot Value Management, LLC | 20 | 0,00 | 4 | 0,00 | ||||
| 2025-10-08 | 13F | Old Point Trust & Financial Services N A | 0 | -100,00 | 0 | -100,00 | ||||
| 2026-02-04 | 13F | BCJ Capital Management, LLC | 0 | -100,00 | 0 | |||||
| 2026-02-13 | 13F | 1248 Management, LLC | 193 | 0,00 | 28 | -17,65 | ||||
| 2025-08-25 | NP | LEGR - First Trust Indxx Innovative Transaction & Process ETF This fund is a listed as child fund of First Trust Advisors Lp and if that institution has disclosed ownership in this security, then these positions will not be double counted when calculating total shares and total value | 9.391 | 5,37 | 1.065 | -9,59 | ||||
| 2026-02-09 | 13F | Cary Street Partners Financial Llc | 4.725 | -2,32 | 693 | -19,91 | ||||
| 2025-11-12 | 13F | united american securities inc. (d/b/a uas asset management) | 20.000 | 3.575 | ||||||
| 2026-01-21 | 13F | Brown Shipley& Co Ltd | 527 | -18,92 | 77 | -33,62 | ||||
| 2026-01-30 | 13F/A | M&t Bank Corp | 22.164 | 355,96 | 3.249 | 274,19 | ||||
| 2026-02-12 | 13F | Integrated Quantitative Investments LLC | 36.881 | -28,60 | 5.406 | -41,44 | ||||
| 2025-11-17 | 13F | Sender Co & Partners, Inc. | Call | 14.200 | 9,23 | 2.538 | 72,12 | |||
| 2026-02-10 | 13F | Founders Financial Securities Llc | 2.384 | 5,81 | 349 | -13,18 | ||||
| 2026-02-13 | 13F | Financial Sense Advisors, Inc. | 17.276 | 185,74 | 2.532 | 134,44 | ||||
| 2025-11-17 | 13F | GWM Advisors LLC | 1 | 0,00 | 4 | |||||
| 2026-02-13 | 13F | Forest Avenue Capital Management LP | 0 | -100,00 | 0 | |||||
| 2026-01-20 | 13F | Hanson & Doremus Investment Management | 0 | -100,00 | 0 | |||||
| 2026-01-21 | 13F | Truefg, Llc | 2.090 | 1,70 | 306 | -16,62 | ||||
| 2026-01-22 | 13F | Massachusetts Financial Services Co /ma/ | 193.982 | -4,82 | 28.434 | -21,94 | ||||
| 2025-08-28 | NP | QEMM - SPDR MSCI Emerging Markets StrategicFactors ETF | 156 | -3,70 | 18 | -19,05 | ||||
| 2025-08-14 | 13F | Voloridge Investment Management, Llc | 0 | -100,00 | 0 | -100,00 | ||||
| 2026-02-06 | 13F | Saranac Partners Ltd | 0 | -100,00 | 0 | -100,00 | ||||
| 2025-09-29 | NP | POAGX - PRIMECAP Odyssey Aggressive Growth Fund | 1.058.800 | -13,00 | 127.723 | -12,12 | ||||
| 2026-01-14 | 13F | Nova Wealth Management, Inc. | 30 | 0,00 | 4 | -20,00 | ||||
| 2026-01-21 | 13F | Banque de Luxembourg S.A. | 778 | 114 | ||||||
| 2026-02-13 | 13F | Missouri Trust & Investment Co | 13.950 | 9,41 | 2.045 | -10,27 | ||||
| 2025-11-14 | 13F | Mangrove Partners | 0 | -100,00 | 0 | -100,00 | ||||
| 2026-02-13 | 13F | Diametric Capital, LP | 0 | -100,00 | 0 | |||||
| 2026-01-16 | 13F | Marino, Stram & Associates Llc | 3.494 | 0,00 | 512 | -17,95 | ||||
| 2026-01-30 | 13F | Kohmann Bosshard Financial Services, LLC | 100 | 15 | ||||||
| 2026-02-10 | 13F | Bnp Paribas Arbitrage, Sa | 1.151.403 | -25,35 | 168.773 | -38,77 | ||||
| 2025-11-14 | 13F | Sandler Capital Management | 6.136 | 1.097 | ||||||
| 2026-02-10 | 13F | Bnp Paribas Arbitrage, Sa | Put | 3.611 | -57,88 | 52.930 | -65,46 | |||
| 2026-02-10 | 13F | Bnp Paribas Arbitrage, Sa | Call | 17.102 | 111,84 | 250.681 | 73,74 | |||
| 2026-01-28 | 13F | Momentum Wealth Planning, LLC | 0 | -100,00 | 0 | -100,00 | ||||
| 2025-08-27 | NP | RYRIX - Retailing Fund Investor Class | 1.407 | 42,12 | 160 | 22,31 | ||||
| 2026-01-21 | 13F | Mainstream Capital Management LLC | 8.504 | 5,57 | 1.247 | -13,41 | ||||
| 2025-09-29 | NP | AIM INTERNATIONAL MUTUAL FUNDS (INVESCO INTERNATIONAL MUTUAL FUNDS) - Invesco Oppenheimer International Growth Fund Class C | 980.634 | -1,53 | 118.294 | -0,54 | ||||
| 2025-08-15 | 13F | WFA of San Diego, LLC | 15 | -40,00 | 2 | -50,00 | ||||
| 2026-02-12 | 13F | StoneX Group Inc. | 6.243 | 926 | ||||||
| 2025-11-13 | 13F | Limestone Investment Advisors LP | 39.405 | 2,42 | 7.043 | 61,40 | ||||
| 2025-11-14 | 13F | VestGen Advisors, LLC | 19.551 | 95,84 | 3.494 | 208,66 | ||||
| 2026-01-27 | 13F | BigSur Wealth Management LLC | 21.130 | 0,00 | 3.097 | -17,98 | ||||
| 2025-11-14 | 13F | Harris Associates L P | 2.155 | -14,31 | 385 | 35,09 | ||||
| 2025-08-14 | 13F | Susquehanna Advisors Group, Inc. | 0 | -100,00 | 0 | -100,00 | ||||
| 2026-02-12 | 13F | Brinker Capital Investments, LLC | 42.962 | 8,43 | 6.297 | -11,07 | ||||
| 2025-08-27 | NP | RYDEX VARIABLE TRUST - Retailing Fund Variable Annuity | 467 | 34,97 | 53 | 15,56 | ||||
| 2026-01-29 | 13F | Calamos Advisors LLC | 58.704 | 15,55 | 8.605 | -5,23 | ||||
| 2026-02-03 | 13F | Highlander Partners, L.P. | 87.200 | 0,00 | 12.782 | -17,99 | ||||
| 2026-02-11 | 13F | Deutsche Bank Ag\ | 129.736 | 138,31 | 19.017 | 95,44 | ||||
| 2026-02-12 | 13F | Xxi Wealth, Llc | 4.645 | 681 | ||||||
| 2025-11-14 | 13F | Sompo Japan Nipponkoa Asset Management Co.,ltd. | 0 | -100,00 | 0 | |||||
| 2026-01-09 | 13F | SG Americas Securities, LLC | Call | 479.800 | -13,81 | 12 | -64,52 | |||
| 2026-02-13 | 13F | Squarepoint Ops LLC | 323.260 | -45,39 | 47.383 | -55,21 | ||||
| 2025-11-12 | 13F | Angeles Wealth Management, Llc | 37.737 | 0,17 | 6.745 | 57,87 | ||||
| 2026-02-10 | 13F | Hazlett, Burt & Watson, Inc. | 251 | 6,36 | 0 | |||||
| 2026-01-28 | 13F | Davis Capital Management | 24 | 0,00 | 4 | -25,00 | ||||
| 2026-01-14 | 13F | ORG Wealth Partners, LLC | 11.164 | 0,25 | 1.636 | -17,79 | ||||
| 2026-02-13 | 13F | Wells Fargo & Company/mn | Put | 105.000 | -66,67 | 15.391 | -72,66 | |||
| 2026-02-13 | 13F | Squarepoint Ops LLC | Call | 593.400 | 94,88 | 86.981 | 59,82 | |||
| 2026-02-13 | 13F | Squarepoint Ops LLC | Put | 1.500.000 | -14,18 | 219.870 | -29,62 | |||
| 2026-01-21 | 13F | Prime Capital Investment Advisors, LLC | 27.562 | 17,15 | 4.040 | -3,92 | ||||
| 2026-02-13 | 13F | Wells Fargo & Company/mn | Call | 250.000 | 23,27 | 36.645 | 1,10 | |||
| 2026-02-13 | 13F | Wells Fargo & Company/mn | 1.900.503 | -21,19 | 278.576 | -35,36 | ||||
| 2026-01-21 | 13F | Modera Wealth Management, LLC | 0 | -100,00 | 0 | |||||
| 2026-02-13 | 13F | Eschler Asset Management LLP | 0 | -100,00 | 0 | |||||
| 2026-02-13 | 13F | Dodge & Cox | 10.016.870 | -8,73 | 1.468.273 | -25,15 | ||||
| 2025-08-28 | NP | QCSTRX - Stock Account Class R1 | 479.003 | -98,19 | 54.324 | -85,50 | ||||
| 2026-01-23 | 13F | Factory Mutual Insurance Co | 53.446 | 12,00 | 7.834 | -8,15 | ||||
| 2026-01-21 | 13F | Hartford Financial Management Inc. | 30 | 0,00 | 4 | -20,00 | ||||
| 2026-02-13 | 13F | Atlas Capital Advisors Llc | 609 | 0,00 | 89 | 28,99 | ||||
| 2026-02-13 | 13F | Golden State Wealth Management, LLC | 571 | -53,24 | 84 | -61,93 | ||||
| 2025-11-14 | 13F | MIRAE ASSET GLOBAL ETFS HOLDINGS Ltd. | 1.399.205 | 31,71 | 250.112 | 107,57 | ||||
| 2025-11-06 | 13F | Abich Financial Wealth Management LLC | 43 | 8 | ||||||
| 2026-01-16 | 13F | FNY Investment Advisers, LLC | 0 | -100,00 | 0 | -100,00 | ||||
| 2026-01-16 | 13F | FNY Investment Advisers, LLC | Put | 0 | -100,00 | 0 | ||||
| 2026-01-26 | 13F | Cwm, Llc | 12.183 | 20,22 | 2 | 0,00 | ||||
| 2025-11-13 | 13F | FIL Ltd | 50.627 | -40,10 | 9.049 | -5,60 | ||||
| 2026-01-08 | 13F | Cooper Financial Group | 2.342 | -2,29 | 343 | -19,86 | ||||
| 2026-02-11 | 13F | Mirae Asset Securities (usa) Inc. | Put | 175.413 | 250,83 | 25.652 | 187,05 | |||
| 2026-02-13 | 13F | Aptus Capital Advisors, LLC | 2.413 | 17,14 | 354 | -4,08 | ||||
| 2026-01-06 | 13F | Chemistry Wealth Management LLC | 14.552 | -4,11 | 2.133 | -21,35 | ||||
| 2026-02-11 | 13F | Palladiem, Llc | 255 | 38 | ||||||
| 2026-01-06 | 13F | Barden Capital Management, Inc. | 5.095 | 0,87 | 747 | -17,29 | ||||
| 2026-02-05 | 13F | Central Asset Investments & Management Holdings (HK) Ltd | 33.409 | 51,80 | 4.897 | 24,51 | ||||
| 2026-02-12 | 13F | Concorde Asset Management, LLC | 6.293 | -0,08 | 922 | -22,52 | ||||
| 2026-02-11 | 13F | Jessup Wealth Management, Inc | 75.107 | 0,57 | 11.009 | -17,52 | ||||
| 2025-11-14 | 13F | Banco Bilbao Vizcaya Argentaria, S.a. | 294.446 | -32,48 | 52.865 | 7,23 | ||||
| 2026-01-23 | 13F | Portman Square Capital LLP | Put | 282.900 | 41.467 | |||||
| 2026-01-29 | 13F | Atlas Legacy Advisors, LLC | 2.229 | -26,82 | 331 | -39,15 | ||||
| 2025-10-30 | 13F | Ridgewood Investments LLC | 7.346 | 31,34 | 1.313 | 106,94 | ||||
| 2026-02-05 | 13F | Cardinal Point Capital Management, ULC | 0 | -100,00 | 0 | |||||
| 2025-08-28 | NP | CEMVX - Causeway Emerging Markets Fund Investor Class | 447.674 | -13,31 | 50.771 | -25,65 | ||||
| 2026-02-12 | 13F | JPL Wealth Management, LLC | 0 | -100,00 | 0 | |||||
| 2026-02-11 | 13F | Mirae Asset Securities (usa) Inc. | 175.413 | 249,99 | 25.712 | 187,06 | ||||
| 2026-02-06 | 13F | Intrust Bank Na | 0 | -100,00 | 0 | |||||
| 2026-01-28 | 13F | Eagle Global Advisors Llc | 37.624 | 7,63 | 5.515 | -11,75 | ||||
| 2025-11-14 | 13F | Summit Partners Public Asset Management, Llc | Call | 0 | -100,00 | 0 | -100,00 | |||
| 2025-11-14 | 13F | Warther Private Wealth, LLC | 239.332 | -15,78 | 42.776 | 32,73 | ||||
| 2026-01-30 | 13F | Bell & Brown Wealth Advisors, Llc | 37.375 | -4,18 | 5.478 | -21,42 | ||||
| 2026-02-10 | 13F | Acadian Asset Management Llc | 16.600 | -24,58 | 2 | -33,33 | ||||
| 2026-02-13 | 13F | Clear Street Group Inc. | 725.753 | 0,00 | 106.381 | -17,99 | ||||
| 2025-11-14 | 13F | Mpwm Advisory Solutions, Llc | 181 | 4,02 | 32 | 68,42 | ||||
| 2025-11-13 | 13F | Family Management Corp | 21.900 | 2,34 | 3.914 | 61,34 | ||||
| 2025-11-14 | 13F | Ancora Advisors, LLC | 103 | -26,95 | 18 | 20,00 | ||||
| 2026-02-10 | 13F | Ritter Daniher Financial Advisory LLC / DE | 233 | 0,00 | 34 | -17,07 | ||||
| 2025-08-21 | NP | MXENX - Great-West Emerging Markets Equity Fund Institutional Class | 3.092.900 | 20,11 | 43.783 | 2,76 | ||||
| 2026-02-11 | 13F | Prestige Wealth Management Group LLC | 10 | 0,00 | 1 | 0,00 | ||||
| 2025-10-31 | 13F | Whittier Trust Co Of Nevada Inc | 0 | -100,00 | 0 | |||||
| 2026-02-12 | 13F | Moneta Group Investment Advisors Llc | 2.412 | 43,83 | 354 | 18,06 | ||||
| 2025-10-27 | 13F | Henry James International Management Inc. | 28.569 | 0,21 | 5.106 | 57,93 | ||||
| 2025-09-25 | NP | DFEV - Dimensional Emerging Markets Value ETF | 8.132 | -73,38 | 981 | -73,14 | ||||
| 2025-08-27 | NP | Advanced Series Trust - Ast Prudential Growth Allocation Portfolio | 34.932 | 13,73 | 3.962 | -2,46 | ||||
| 2026-01-23 | 13F | Nbt Bank N A /ny | 147 | -17,88 | 7 | -12,50 | ||||
| 2026-02-12 | 13F | Marex Group plc | 194.435 | 4,53 | 28.500 | -14,27 | ||||
| 2026-02-05 | 13F | High Note Wealth, LLC | 98 | 0,00 | 14 | -17,65 | ||||
| 2026-02-13 | 13F | Flow Traders U.s. Llc | 13.602 | -19,86 | 2 | -66,67 | ||||
| 2026-01-27 | 13F | Fortis Capital Advisors, LLC | 7.640 | -7,48 | 1.120 | -24,14 | ||||
| 2026-01-05 | 13F | Catherine Avery Investment Management LLC | 0 | -100,00 | 0 | -100,00 | ||||
| 2025-11-17 | 13F | Armistice Capital, Llc | 156.000 | 168,97 | 27.882 | 323,92 | ||||
| 2025-08-14 | 13F | Kamunting Street Capital Management, L.P. | 0 | -100,00 | 0 | -100,00 | ||||
| 2026-01-21 | 13F | South Shore Capital Advisors | 1.545 | 226 | ||||||
| 2026-01-22 | 13F | Sterneck Capital Management, LLC | 3.126 | -0,79 | 458 | -18,65 | ||||
| 2025-09-25 | NP | PRIGX - T. Rowe Price Institutional Global Value Equity Fund This fund is a listed as child fund of Price T Rowe Associates Inc /md/ and if that institution has disclosed ownership in this security, then these positions will not be double counted when calculating total shares and total value | 0 | -100,00 | 0 | -100,00 | ||||
| 2026-02-13 | 13F | Parkside Financial Bank & Trust | 115 | 0,00 | 17 | -20,00 | ||||
| 2026-02-12 | 13F | Bradley Foster & Sargent Inc/ct | 8.523 | 5,46 | 1.249 | -13,50 | ||||
| 2026-01-21 | 13F | Newbridge Financial Services Group, Inc. | 263 | -93,68 | 39 | -94,89 | ||||
| 2026-01-22 | 13F | Maseco Llp | 66 | 10 | ||||||
| 2026-02-10 | 13F | Goldman Sachs Group Inc | 7.665.293 | -34,89 | 1.123.579 | -46,60 | ||||
| 2026-02-10 | 13F | Goldman Sachs Group Inc | Call | 4.243.500 | -4,44 | 622.012 | -21,63 | |||
| 2026-02-10 | 13F | Goldman Sachs Group Inc | Put | 2.811.800 | -43,28 | 412.154 | -53,48 | |||
| 2026-02-12 | 13F | Aviva Plc | 348.228 | -8,92 | 51.043 | -25,30 | ||||
| 2026-02-13 | 13F | Yakira Capital Management, Inc. | 0 | -100,00 | 0 | |||||
| 2025-08-21 | NP | GBFAX - Emerging Markets Fund Class A | 55.000 | 30,95 | 6.238 | 12,32 | ||||
| 2025-10-16 | 13F | Portman Square Capital LLP | 0 | -100,00 | 0 | -100,00 | ||||
| 2026-02-12 | 13F | Rossby Financial, LCC | 111 | -13,28 | 16 | -30,43 | ||||
| 2025-11-14 | 13F | Think Investments LP | 242.548 | 0,00 | 43.351 | 57,60 | ||||
| 2026-02-13 | 13F | Wealth Alliance | 8.402 | -4,11 | 1.232 | -21,39 | ||||
| 2025-11-14 | 13F | Susquehanna International Group, Llp | Call | 26.936.800 | 32,89 | 4.814.414 | 109,43 | |||
| 2025-11-14 | 13F | Susquehanna International Group, Llp | Put | 10.225.700 | -3,28 | 1.827.639 | 52,42 | |||
| 2025-11-13 | 13F | Triata Capital Ltd | 162.241 | 139,86 | 28.997 | 278,01 | ||||
| 2025-11-14 | 13F | Parkwood LLC | 0 | -100,00 | 0 | |||||
| 2025-11-14 | 13F | Susquehanna International Group, Llp | 197.239 | -74,00 | 35.253 | -59,03 | ||||
| 2025-08-28 | NP | JINTX - Johnson International Fund | 2.000 | 0,00 | 227 | -14,39 | ||||
| 2026-01-29 | 13F | Ariose Capital Management Ltd | 0 | -100,00 | 0 | |||||
| 2025-11-13 | 13F | Grantham, Mayo, Van Otterloo & Co. LLC | 108.314 | -64,04 | 19.359 | -43,33 | ||||
| 2026-02-13 | 13F | ShawSpring Partners LLC | 378.155 | 55.430 | ||||||
| 2026-02-04 | 13F | Atlantic Union Bankshares Corp | 757 | -2,57 | 111 | -20,29 | ||||
| 2026-01-15 | 13F | Bernard Wealth Management Corp. | 150 | 0,00 | 22 | -19,23 | ||||
| 2026-01-16 | 13F | Compagnie Lombard Odier SCmA | Call | 0 | 0 | |||||
| 2025-11-14 | 13F | Concentric Capital Strategies, LP | 0 | -100,00 | 0 | |||||
| 2026-01-15 | 13F | SILVER OAK SECURITIES, Inc | 1.995 | 0,15 | 294 | -17,70 | ||||
| 2025-11-12 | 13F | Blair William & Co/il | 88.455 | -1,70 | 15.810 | 54,91 | ||||
| 2026-01-23 | 13F | Sage Investment Counsel LLC | 3.359 | -4,41 | 492 | -21,66 | ||||
| 2025-10-08 | 13F | Rise Advisors, LLC | 0 | -100,00 | 0 | |||||
| 2026-02-11 | 13F | Simplex Trading, Llc | 228.100 | 66.401,46 | 33.435 | |||||
| 2025-11-14 | 13F | Newlands Management Operations LLC | 269.858 | 0,00 | 48.232 | 57,60 | ||||
| 2026-02-11 | 13F | Simplex Trading, Llc | Call | 3.483.000 | -29,56 | 490.947 | 60.064,95 | |||
| 2025-11-10 | 13F | Optiver Holding B.V. | Call | 0 | -100,00 | 0 | -100,00 | |||
| 2026-02-11 | 13F | Simplex Trading, Llc | Put | 2.559.200 | -14,50 | 350.048 | 65.451,87 | |||
| 2025-11-10 | 13F | Optiver Holding B.V. | 0 | -100,00 | 0 | -100,00 | ||||
| 2026-01-09 | 13F | SG Americas Securities, LLC | Put | 695.700 | -32,09 | 1 | ||||
| 2026-02-03 | 13F | Alpha Cubed Investments, LLC | 5.667 | 2,61 | 831 | -15,91 | ||||
| 2026-02-13 | 13F | Headlands Technologies LLC | 0 | -100,00 | 0 | |||||
| 2026-01-06 | 13F | Canal Capital Management, LLC | 36.207 | -12,20 | 5.307 | -27,99 | ||||
| 2026-02-02 | 13F | Oppenheimer & Co Inc | 58.315 | -17,38 | 8.548 | -32,24 | ||||
| 2026-01-22 | 13F | Apollon Wealth Management, LLC | 5.310 | 24,47 | 778 | 2,10 | ||||
| 2026-02-10 | 13F | GKV Capital Management Co., Inc. | 24.650 | 9,65 | 3.613 | -10,06 | ||||
| 2025-12-01 | 13F/A | Cantor Fitzgerald, L. P. | 24.140 | -97,63 | 4.315 | -96,27 | ||||
| 2026-02-02 | 13F | JDM Financial Group LLC | 110 | 0,00 | 16 | -15,79 | ||||
| 2026-02-13 | 13F | Gmt Capital Corp | 30.800 | -81,47 | 4.515 | -84,80 | ||||
| 2026-01-12 | 13F | Byrne Asset Management LLC | 3.422 | -9,69 | 502 | -26,00 | ||||
| 2025-09-26 | NP | PCIEX - PACE International Equity Investments Class P | 24.763 | 1,18 | 2.987 | 2,22 | ||||
| 2026-01-14 | 13F | Mirador Capital Partners LP | 2.132 | -0,65 | 313 | -18,54 | ||||
| 2026-01-16 | 13F | Compagnie Lombard Odier SCmA | 112.204 | 5,58 | 16.447 | -13,41 | ||||
| 2026-01-26 | 13F | PDS Planning, Inc | 7.986 | 4,16 | 1.171 | -14,60 | ||||
| 2025-09-24 | NP | BlackRock ETF Trust - iShares A.I. Innovation and Tech Active ETF | 0 | -100,00 | 0 | -100,00 | ||||
| 2025-10-27 | 13F | Hardman Johnston Global Advisors LLC | 0 | -100,00 | 0 | |||||
| 2025-09-26 | NP | UGPIX - UltraChina ProFund Investor Class | 35.722 | 30,48 | 4.309 | 31,81 | ||||
| 2026-02-13 | 13F | GM Advisory Group, Inc. | 0 | -100,00 | 0 | |||||
| 2025-08-27 | NP | RYDEX VARIABLE TRUST - Internet Fund Variable Annuity | 694 | 16,84 | 79 | 0,00 | ||||
| 2026-01-09 | 13F | SG Americas Securities, LLC | 1.703.760 | 1.877,80 | 250 | 1.560,00 | ||||
| 2026-01-26 | 13F | Patriot Financial Group Insurance Agency, LLC | 5.642 | 22,25 | 827 | 0,36 | ||||
| 2026-01-21 | 13F | Summa Corp. | 4.079 | -87,68 | 598 | -89,91 | ||||
| 2025-11-14 | 13F | Aperture Investors, LLC | 33.864 | 0,00 | 6.053 | 57,60 | ||||
| 2025-11-04 | 13F | Twenty Acre Capital LP | 0 | -100,00 | 0 | |||||
| 2025-11-07 | 13F | Sierra Ocean, Llc | 0 | -100,00 | 0 | |||||
| 2025-11-12 | 13F | NewSquare Capital LLC | 0 | -100,00 | 0 | |||||
| 2026-02-11 | 13F | Marest Capital, LLC | 0 | -100,00 | 0 | |||||
| 2025-11-10 | 13F | Kovitz Investment Group Partners, LLC | 5.696 | -8,07 | 1.018 | 44,81 | ||||
| 2026-01-08 | 13F | O'Keefe Stevens Advisory, Inc. | 84.242 | 0,02 | 12.348 | -17,96 | ||||
| 2026-02-10 | 13F | Meitav Dash Investments Ltd | 12.601 | -0,20 | 1.849 | -18,19 | ||||
| 2026-02-12 | 13F | Elo Mutual Pension Insurance Co | 117.748 | 378,09 | 17.260 | 292,16 | ||||
| 2026-02-05 | 13F | IMG Wealth Management, Inc. | 7 | 0,00 | 1 | 0,00 | ||||
| 2026-02-06 | 13F | Cedar Wealth Management, LLC | 57 | 0,00 | 8 | -20,00 | ||||
| 2026-01-15 | 13F | J. Safra Sarasin Holding AG | 6.532 | 66,21 | 957 | 36,32 | ||||
| 2025-09-26 | NP | UUPIX - Ultraemerging Markets Profund Investor Class | 9.739 | 41,06 | 1.175 | 42,48 | ||||
| 2026-01-28 | 13F | Loring Wolcott & Coolidge Fiduciary Advisors Llp/ma | 162 | 0,00 | 28 | 0,00 | ||||
| 2026-02-03 | 13F | Virtus Family Office LLC | 28.081 | -1,29 | 4.116 | -19,04 | ||||
| 2025-08-14 | 13F | Bluefin Capital Management, Llc | 8.000 | 907 | ||||||
| 2026-02-09 | 13F | Unified Investment Management | 1.728 | 3,29 | 253 | -15,38 | ||||
| 2026-02-03 | 13F | Mma Asset Management Llc | 0 | -100,00 | 0 | |||||
| 2025-11-19 | 13F | Sunbelt Securities, Inc. | 7.926 | -37,33 | 1.417 | 32,09 | ||||
| 2025-09-26 | NP | CVAR - Cultivar ETF | 1.034 | 0,78 | 125 | 1,64 | ||||
| 2026-01-27 | 13F | TD Waterhouse Canada Inc. | 24.132 | -10,84 | 3.536 | -28,52 | ||||
| 2026-01-23 | 13F | Webster Bank, N. A. | 1.023 | 0,00 | 150 | -18,13 | ||||
| 2026-02-11 | 13F | Primecap Management Co/ca/ | 18.977.436 | -5,06 | 2.781.713 | -22,14 | ||||
| 2025-11-14 | 13F | KEYWISE CAPITAL MANAGEMENT (HK) Ltd | 0 | -100,00 | 0 | -100,00 | ||||
| 2026-02-12 | 13F | Steward Partners Investment Advisory, Llc | 343.098 | -7,77 | 50.291 | -24,36 | ||||
| 2025-08-21 | NP | IEQ - Lazard International Dynamic Equity ETF | 776 | 88 | ||||||
| 2025-09-25 | NP | Elevation Series Trust - The Opal International Dividend Income ETF | 18.641 | 4,13 | 2.249 | 5,19 | ||||
| 2026-01-23 | 13F | Brown, Lisle/cummings, Inc. | 13 | 0,00 | 2 | -50,00 | ||||
| 2026-01-30 | 13F | Us Bancorp \de\ | 25.885 | -0,72 | 3.795 | -18,58 | ||||
| 2026-01-09 | 13F | jvl associates llc | 12.319 | 0,00 | 1.806 | -17,99 | ||||
| 2025-08-25 | NP | SISLX - Shelton International Select Equity Fund Investor Class | 1.500 | -91,12 | 170 | -27,97 | ||||
| 2026-02-03 | 13F | Ethic Inc. | 28.392 | 1,24 | 4.162 | -16,98 | ||||
| 2026-02-09 | 13F | HBK Sorce Advisory LLC | 3.929 | 0,95 | 639 | -1,09 | ||||
| 2026-01-20 | 13F | Signaturefd, Llc | 20.058 | 2,53 | 2.940 | -15,90 | ||||
| 2025-11-17 | 13F | FSA Wealth Management LLC | 64 | 357,14 | 11 | 1.000,00 | ||||
| 2026-02-09 | 13F | Choate Investment Advisors | 2.993 | 18,82 | 439 | -2,67 | ||||
| 2025-11-13 | 13F | Rehmann Capital Advisory Group | 7.960 | 0,51 | 1.427 | 58,80 | ||||
| 2025-11-14 | 13F | HighVista Strategies LLC | 3.757 | 0,00 | 671 | 57,51 | ||||
| 2026-02-09 | 13F | Bleakley Financial Group, LLC | 16.420 | 0,41 | 2.407 | -17,66 | ||||
| 2025-11-12 | 13F | Quantbot Technologies LP | 0 | -100,00 | 0 | |||||
| 2025-11-14 | 13F | Intrinsic Value Partners, LLC | 0 | -100,00 | 0 | -100,00 | ||||
| 2025-11-14 | 13F | Hilltop Holdings Inc. | 4.691 | 838 | ||||||
| 2026-02-02 | 13F | Peregrine Asset Advisers, Inc. | 3.100 | 0,00 | 454 | -18,05 | ||||
| 2026-01-23 | 13F | Diversify Advisory Services, LLC | 1.334 | 221 | ||||||
| 2026-02-02 | 13F | Triasima Portfolio Management inc. | 51.635 | 102,89 | 7.569 | 66,40 | ||||
| 2026-02-13 | 13F | SRS Capital Advisors, Inc. | 7.162 | 79,45 | 1.050 | 47,12 | ||||
| 2025-11-13 | 13F | Tairen Capital Ltd | 240.876 | 43.052 | ||||||
| 2025-08-14 | 13F | Philosophy Capital Management LLC | 0 | -100,00 | 0 | -100,00 | ||||
| 2026-01-26 | 13F | Shelton Wealth Management, Llc | Call | 0 | -100,00 | 0 | ||||
| 2026-02-12 | 13F | Federated Hermes, Inc. | 395.993 | 6.279,78 | 58.045 | 5.133,90 | ||||
| 2026-01-26 | 13F | Shelton Wealth Management, Llc | 0 | -100,00 | 0 | |||||
| 2026-02-12 | 13F | Voya Investment Management Llc | 548.393 | 1,93 | 80.383 | -16,41 | ||||
| 2026-02-13 | 13F | Keystone Investors Pte Ltd | 0 | -100,00 | 0 | |||||
| 2025-08-26 | NP | Profunds - Profund Vp Emerging Markets | 34.076 | 32,35 | 3.865 | 13,51 | ||||
| 2025-08-28 | NP | EEMX - SPDR MSCI Emerging Markets Fossil Fuel Reserves Free ETF | 1.463 | -4,13 | 166 | -17,91 | ||||
| 2026-01-14 | 13F | Spire Wealth Management | 2.784 | -55,23 | 408 | -63,28 | ||||
| 2026-01-26 | 13F | SeaBridge Investment Advisors LLC | 32.411 | -0,48 | 4.751 | -18,38 | ||||
| 2026-01-16 | 13F | Empirical Financial Services, LLC d.b.a. Empirical Wealth Management | 6.085 | 85,63 | 892 | 52,31 | ||||
| 2026-02-02 | 13F | Pittenger & Anderson Inc | 33.850 | 0,00 | 4.962 | -18,00 | ||||
| 2025-11-14 | 13F | Avenir Tech Ltd | 0 | -100,00 | 0 | |||||
| 2026-01-12 | 13F | AllSquare Wealth Management LLC | 115 | 0,00 | 21 | 53,85 | ||||
| 2026-02-03 | 13F | Costello Asset Management, INC | 229 | 34 | ||||||
| 2026-01-26 | 13F | Independent Wealth Network Inc. | 2.242 | -3,15 | 329 | -20,58 | ||||
| 2025-11-14 | 13F | Silvercrest Asset Management Group Llc | 2.162 | 386 | ||||||
| 2025-10-31 | 13F | National Asset Management, Inc. | 13.816 | -5,54 | 2.469 | 48,91 | ||||
| 2025-08-28 | NP | DODWX - Dodge & Cox Global Stock Fund | 965.300 | -15,80 | 109.475 | -27,79 | ||||
| 2025-11-14 | 13F | Aspen Grove Capital, LLC | 2.689 | 1,66 | 481 | 57,38 | ||||
| 2026-01-20 | 13F | Arta Finance Wealth Management LLC | 2.792 | 409 | ||||||
| 2026-02-11 | 13F | Clifford Swan Investment Counsel Llc | 4.255 | 0,00 | 624 | -18,03 | ||||
| 2026-02-11 | 13F | Entelevest, LLC | 1.812 | 266 | ||||||
| 2026-02-11 | 13F | Janney Montgomery Scott LLC | 66.160 | -5,81 | 10 | -25,00 | ||||
| 2025-10-31 | 13F | National Asset Management, Inc. | Call | 400.000 | 9.900,00 | 715 | 57,62 | |||
| 2025-11-14 | 13F | Bayesian Capital Management, LP | 2.000 | 357 | ||||||
| 2026-01-15 | 13F | Gunderson Capital Management Inc. | 0 | -100,00 | 0 | |||||
| 2025-11-14 | 13F | Tang Capital Management Llc | 70.000 | 0,00 | 12.511 | 57,61 | ||||
| 2026-02-02 | 13F | Del-Sette Capital Management, LLC | 0 | -100,00 | 0 | |||||
| 2026-01-05 | 13F | Noble Wealth Management PBC | 1.130 | -5,83 | 166 | -22,90 | ||||
| 2026-01-23 | 13F | TFC Financial Management | 10 | 0,00 | 1 | 0,00 | ||||
| 2025-08-14 | NP | CCGSX - Chautauqua Global Growth Fund Investor Class | 61.366 | 2,96 | 6.960 | -11,70 | ||||
| 2025-11-14 | 13F | H&H International Investment, LLC | 2.777.330 | -25,86 | 496.392 | 16,84 | ||||
| 2026-02-02 | 13F | Oppenheimer Asset Management Inc. | 73.914 | 7,43 | 10.834 | -11,90 | ||||
| 2025-08-14 | 13F | Hamilton Capital, LLC | 5.173 | 49,68 | 587 | 28,51 | ||||
| 2026-02-12 | 13F | North of South Capital LLP | 39.398 | 12,56 | 5.775 | -7,70 | ||||
| 2026-02-13 | 13F | Glen Eagle Advisors, LLC | 313 | -19,33 | 46 | -34,78 | ||||
| 2026-01-28 | 13F | B. Metzler seel. Sohn & Co. AG | 23.101 | 60,49 | 3.386 | 31,65 | ||||
| 2026-01-30 | 13F | North Star Investment Management Corp. | 1.394 | -26,28 | 204 | -39,47 | ||||
| 2026-01-14 | 13F | ORG Partners LLC | 127 | -75,39 | 19 | -80,43 | ||||
| 2025-10-17 | 13F | FFG Partners, LLC | 0 | -100,00 | 0 | |||||
| 2025-10-03 | NP | NORTHERN LIGHTS FUND TRUST II - PeakShares Sector Rotation ETF | 1.828 | 32,66 | 247 | 57,69 | ||||
| 2025-11-13 | 13F | Quartz Partners, LLC | 0 | -100,00 | 0 | |||||
| 2026-02-13 | 13F | SkyView Investment Advisors, LLC | 15.663 | -0,88 | 3 | 100,00 | ||||
| 2025-09-26 | NP | PCLCX - PACE Large Co Growth Equity Investments Class P | 34.273 | -8,18 | 4.134 | -7,27 | ||||
| 2026-01-27 | 13F | Checchi Capital Advisers, LLC | 2.809 | -0,92 | 412 | -18,77 | ||||
| 2025-09-29 | NP | Calamos Global Total Return Fund | 1.745 | 0,00 | 210 | 0,96 | ||||
| 2026-01-09 | 13F | 180 Wealth Advisors, Llc | 9.035 | 8,82 | 1.324 | -10,72 | ||||
| 2026-02-13 | 13F | Ieq Capital, Llc | 83.880 | -10,69 | 12.295 | -26,75 | ||||
| 2026-02-12 | 13F | Qtron Investments LLC | 0 | -100,00 | 0 | |||||
| 2025-09-29 | NP | AIM INVESTMENT FUNDS (INVESCO INVESTMENT FUNDS) - Invesco Oppenheimer Global Allocation Fund Class R | 5.897 | -45,22 | 711 | -44,67 | ||||
| 2025-08-26 | NP | BGEAX - BRANDES GLOBAL EQUITY FUND Class A | 82.300 | 15,10 | 1.165 | -1,52 | ||||
| 2025-11-14 | 13F | Laidlaw Wealth Management LLC | 9.509 | -0,21 | 1.700 | 57,31 | ||||
| 2026-02-10 | 13F | Future Fund LLC | 11.434 | 1.676 | ||||||
| 2026-02-11 | 13F | Cedar Mountain Advisors, LLC | 11 | 0,00 | 2 | 0,00 | ||||
| 2026-02-12 | 13F | Mosley Wealth Management | 5.532 | 0,60 | 1.002 | 88,51 | ||||
| 2026-02-11 | 13F | X-Square Capital, LLC | 2.327 | -8,35 | 0 | |||||
| 2026-01-28 | 13F | CAPROCK Group, Inc. | 47.104 | 6,53 | 6.905 | 15,66 | ||||
| 2026-02-06 | 13F | Gsa Capital Partners Llp | 0 | -100,00 | 0 | |||||
| 2026-02-12 | 13F | CMT Capital Markets Trading GmbH | Call | 386.000 | 66,02 | 57 | 36,59 | |||
| 2026-02-12 | 13F | CMT Capital Markets Trading GmbH | Put | 208.800 | 31 | |||||
| 2025-11-06 | 13F | Financial Advocates Investment Management | 0 | -100,00 | 0 | |||||
| 2026-01-29 | 13F | RMG Wealth Management LLC | 149 | 0,00 | 27 | 8,33 | ||||
| 2025-09-26 | NP | SPECX - Alger Spectra Fund Class A | 76.294 | -81,20 | 9.203 | -74,62 | ||||
| 2026-02-10 | 13F | Zweig-DiMenna Associates LLC | 137.000 | 149,77 | 20.081 | 104,85 | ||||
| 2025-08-14 | 13F | Fort Point Capital Partners LLC | 0 | -100,00 | 0 | |||||
| 2026-02-13 | 13F | Arkadios Wealth Advisors | Call | 100 | 15 | |||||
| 2026-02-13 | 13F | Arkadios Wealth Advisors | 25.890 | 1,43 | 3.795 | -16,81 | ||||
| 2025-09-29 | NP | CVSIX - Calamos Market Neutral Income Fund Class A | Short | -1.342.000 | -0,00 | -161.885 | 1,00 | |||
| 2025-08-29 | NP | LMORX - Patient Opportunity Trust Class R | 365.000 | -6,41 | 41.395 | -19,73 | ||||
| 2025-11-14 | 13F | Sierra Capital LLC | 2.617 | 0,00 | 0 | |||||
| 2026-02-10 | 13F | Garde Capital, Inc. | 2.207 | 14,06 | 324 | -6,38 | ||||
| 2026-01-21 | 13F | Daytona Street Capital LLC | 687 | 101 | ||||||
| 2026-02-06 | 13F | Mizuho Markets Cayman LP | 0 | -100,00 | 0 | |||||
| 2025-11-14 | 13F | Beacon Pointe Advisors, LLC | 7.356 | 7,11 | 1.315 | 68,89 | ||||
| 2026-02-09 | 13F | CBIZ Investment Advisory Services, LLC | 20 | 3 | ||||||
| 2025-08-29 | NP | DHIYX - Diamond Hill International Fund Class Y | 206.900 | 0,00 | 2.929 | -14,46 | ||||
| 2026-01-15 | 13F/A | Persistent Asset Partners Ltd | 7.000 | 1.251 | ||||||
| 2026-01-27 | 13F | CenterStar Asset Management, LLC | Put | 4.700 | -9,62 | 689 | -25,94 | |||
| 2026-02-09 | 13F | Wellington Shields & Co., LLC | 0 | -100,00 | 0 | |||||
| 2025-08-28 | NP | RWCIX - RWC Global Emerging Equity Fund Class I Shares | 33.413 | -6,52 | 3.789 | -19,83 | ||||
| 2026-02-11 | 13F | Manchester Capital Management LLC | 575 | 84 | ||||||
| 2025-08-27 | NP | SEASONS SERIES TRUST - SA Multi-Managed International Equity Portfolio Class 1 | 790 | -50,00 | 90 | -57,21 | ||||
| 2026-02-10 | 13F/A | Guinness Atkinson Asset Management Inc | 4.801 | 0,00 | 713 | -17,50 | ||||
| 2026-01-16 | 13F | West Branch Capital LLC | 30 | 0,00 | 4 | -20,00 | ||||
| 2026-02-13 | 13F | Marshall Wace, Llp | Call | 45.900 | 6.728 | |||||
| 2026-02-13 | 13F | Marshall Wace, Llp | Put | 12.500 | 1.832 | |||||
| 2026-02-04 | 13F | Naples Global Advisors, Llc | 24.208 | 5,55 | 3.548 | -13,44 | ||||
| 2026-02-13 | 13F | Marshall Wace, Llp | 268.531 | 39.361 | ||||||
| 2026-02-03 | 13F | SBI Securities Co., Ltd. | 23.794 | -8,77 | 3.488 | -25,19 | ||||
| 2025-08-27 | NP | Advanced Series Trust - Ast Balanced Asset Allocation Portfolio | 38.587 | 32,38 | 4.376 | 13,54 | ||||
| 2026-02-06 | 13F | Mizuho Markets Cayman LP | Call | 0 | -100,00 | 0 | ||||
| 2025-11-19 | 13F/A | Regions Financial Corp | 0 | -100,00 | 0 | |||||
| 2026-02-12 | 13F | CMT Capital Markets Trading GmbH | 8.887 | -82,91 | 6 | -33,33 | ||||
| 2025-08-14 | 13F | DZ BANK AG Deutsche Zentral Genossenschafts Bank, Frankfurt am Main | Call | 0 | -100,00 | 0 | -100,00 | |||
| 2026-02-05 | 13F | LGT Fund Management Co Ltd. | 6.200 | 181,82 | 914 | 127,11 | ||||
| 2026-02-12 | 13F | UniSuper Management Pty Ltd | 0 | -100,00 | 0 | |||||
| 2026-02-03 | 13F | CGC Financial Services, LLC | 25 | 0,00 | 4 | -25,00 | ||||
| 2026-02-04 | 13F | Beverly Hills Private Wealth, LLC | 19.112 | 0,00 | 3.416 | 0,00 | ||||
| 2026-02-11 | 13F | First Command Advisory Services, Inc. | 196 | 0,00 | 29 | -20,00 | ||||
| 2026-02-11 | 13F | Capital Group Private Client Services, Inc. | 4.252 | 0,00 | 623 | -17,92 | ||||
| 2025-09-26 | NP | TEQKX - TIAA-CREF Emerging Markets Equity Index Fund Retail Class | 15.571.077 | 6,75 | 234.107 | 7,50 | ||||
| 2025-08-14 | 13F | DRW Securities, LLC | Call | 0 | -100,00 | 0 | -100,00 | |||
| 2025-08-26 | NP | BIECX - BRANDES INTERNATIONAL EQUITY FUND Class C | 2.785.900 | 45,95 | 39.437 | 24,87 | ||||
| 2026-02-06 | 13F | Greenwoods Asset Management Hong Kong Ltd. | 843.409 | 0,00 | 123.627 | -17,99 | ||||
| 2026-02-06 | 13F | Poehling Capital Management, LLC | 37.424 | 1,18 | 5.486 | -17,02 | ||||
| 2025-11-14 | 13F | Credit Agricole S A | 274.706 | -6,07 | 49.098 | 26,97 | ||||
| 2026-02-12 | 13F | Ci Investments Inc. | 990.036 | 95,06 | 145.119 | 161.143,33 | ||||
| 2026-02-13 | 13F | Woodbridge CO LTD | 39.000 | 0,00 | 5.717 | -17,99 | ||||
| 2026-01-02 | 13F | Global Wealth Strategies & Associates | 678 | 0,00 | 99 | -18,18 | ||||
| 2025-08-27 | NP | BIGFX - Baron International Growth Fund | 22.576 | -37,18 | 2.560 | -46,13 | ||||
| 2025-08-26 | NP | IGMAX - VY(R) Invesco Oppenheimer Global Portfolio Class ADV | 110.390 | 0,97 | 12.519 | -13,40 | ||||
| 2026-01-07 | 13F | Sagespring Wealth Partners, Llc | 9.565 | 5,84 | 1.402 | -13,19 | ||||
| 2026-02-09 | 13F | Integrity Advisory Solutions, LLC | 3.295 | 3,16 | 483 | -15,41 | ||||
| 2025-08-14 | 13F | Westerly Capital Management, Llc | 0 | -100,00 | 0 | -100,00 | ||||
| 2026-01-23 | 13F | Private Wealth Management Group, LLC | 50 | 0,00 | 7 | -12,50 | ||||
| 2026-02-12 | 13F | Summit Financial, LLC | 16.110 | -0,12 | 2.361 | -18,08 | ||||
| 2026-02-11 | 13F | BLI - Banque de Luxembourg Investments | 1.400 | 206 | ||||||
| 2026-01-22 | 13F | Weaver Capital Management LLC | 6.812 | 999 | ||||||
| 2025-10-29 | 13F | New Insight Wealth Advisors | 15.516 | 0,00 | 2.773 | 57,65 | ||||
| 2026-01-21 | 13F/A | Winthrop Advisory Group LLC | 3.375 | 0,96 | 492 | -17,76 | ||||
| 2025-08-14 | 13F | Scion Asset Management, LLC | Put | 0 | -100,00 | 0 | -100,00 | |||
| 2026-02-09 | 13F | Eaton Financial Holdings Company, LLC | 8.586 | 1,53 | 1.259 | -16,74 | ||||
| 2026-01-22 | 13F | Douglas Lane & Associates, LLC | 7.494 | -20,04 | 1.098 | -34,41 | ||||
| 2025-11-12 | 13F | Hurley Capital, LLC | 461 | 37,20 | 82 | 115,79 | ||||
| 2025-11-12 | 13F | Hurley Capital, LLC | Call | 4 | 13 | |||||
| 2026-01-27 | 13F | Traphagen Investment Advisors Llc | 3.018 | 0,00 | 442 | -18,00 |